Dashboard
General
The dashboard is one way to interact with Hanami.
Warning
The current dashboard is only a first prototypical implementation and NOT maintained at the momentan due to a lack of time. This documentation is not up-to-date at the moment, I'm very sorry, but it should be still enough to give a basic impression of the current state and workflow.
Example workflow
Login
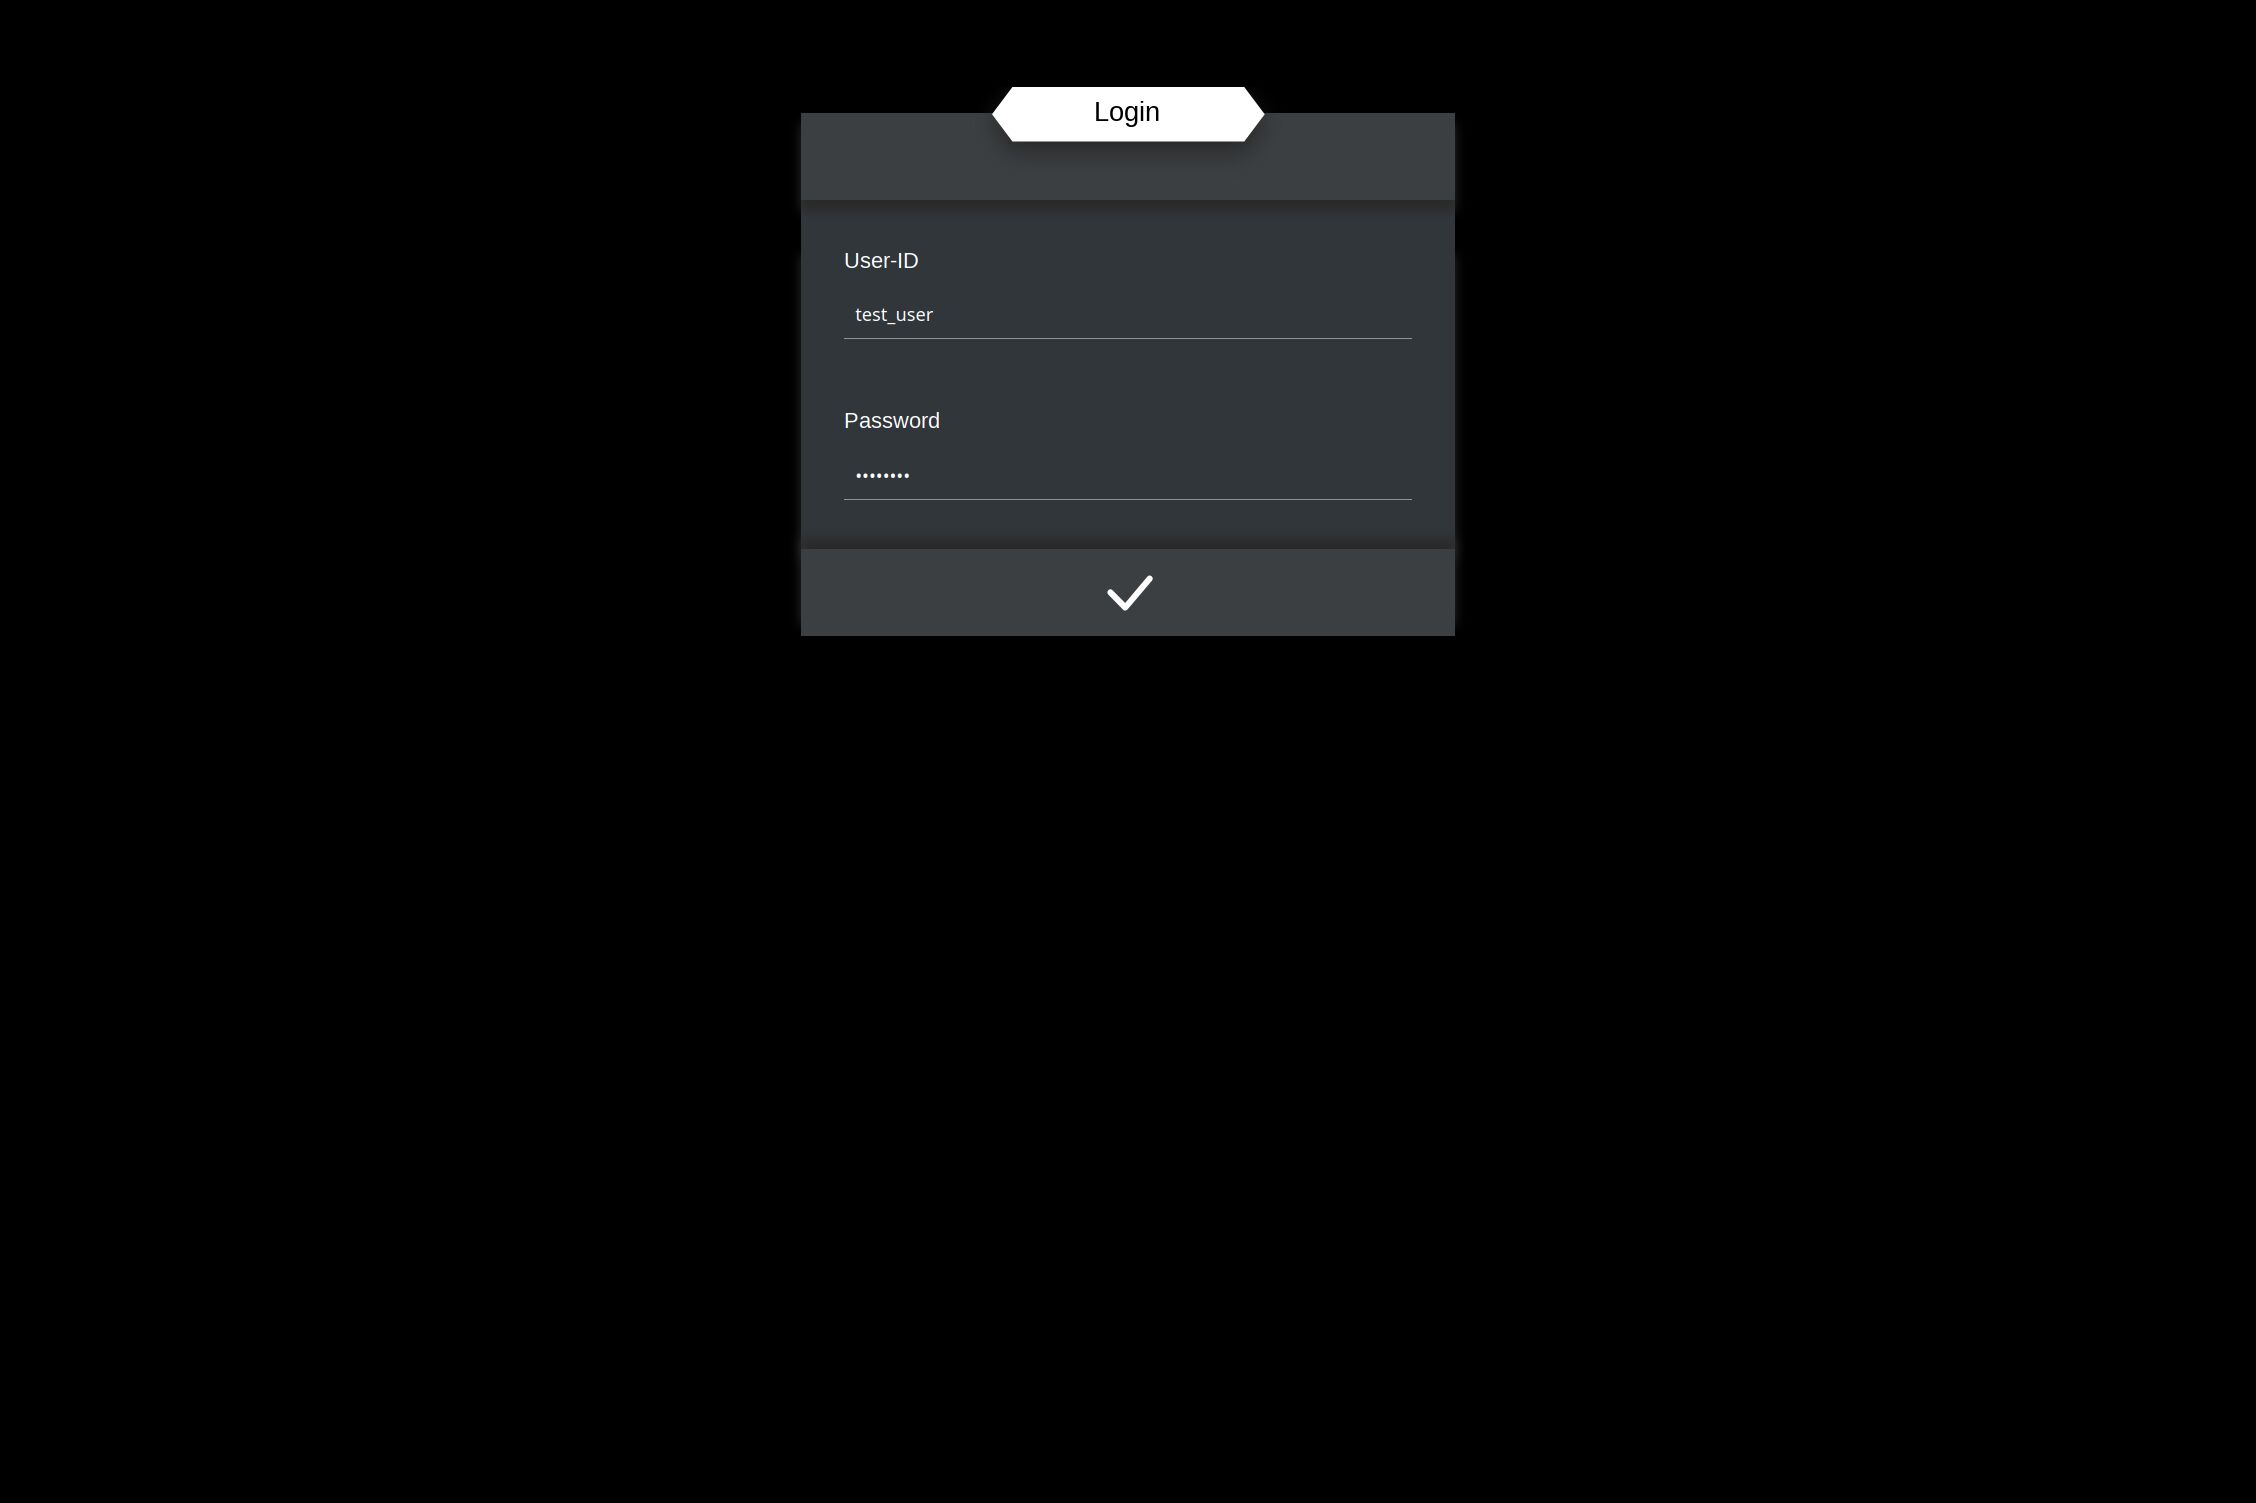
Login should quite self-explaining. In case you used the installation-guide you have to use the values of USER_ID (NOT the USER_NAME) and PASSWORD for the login.
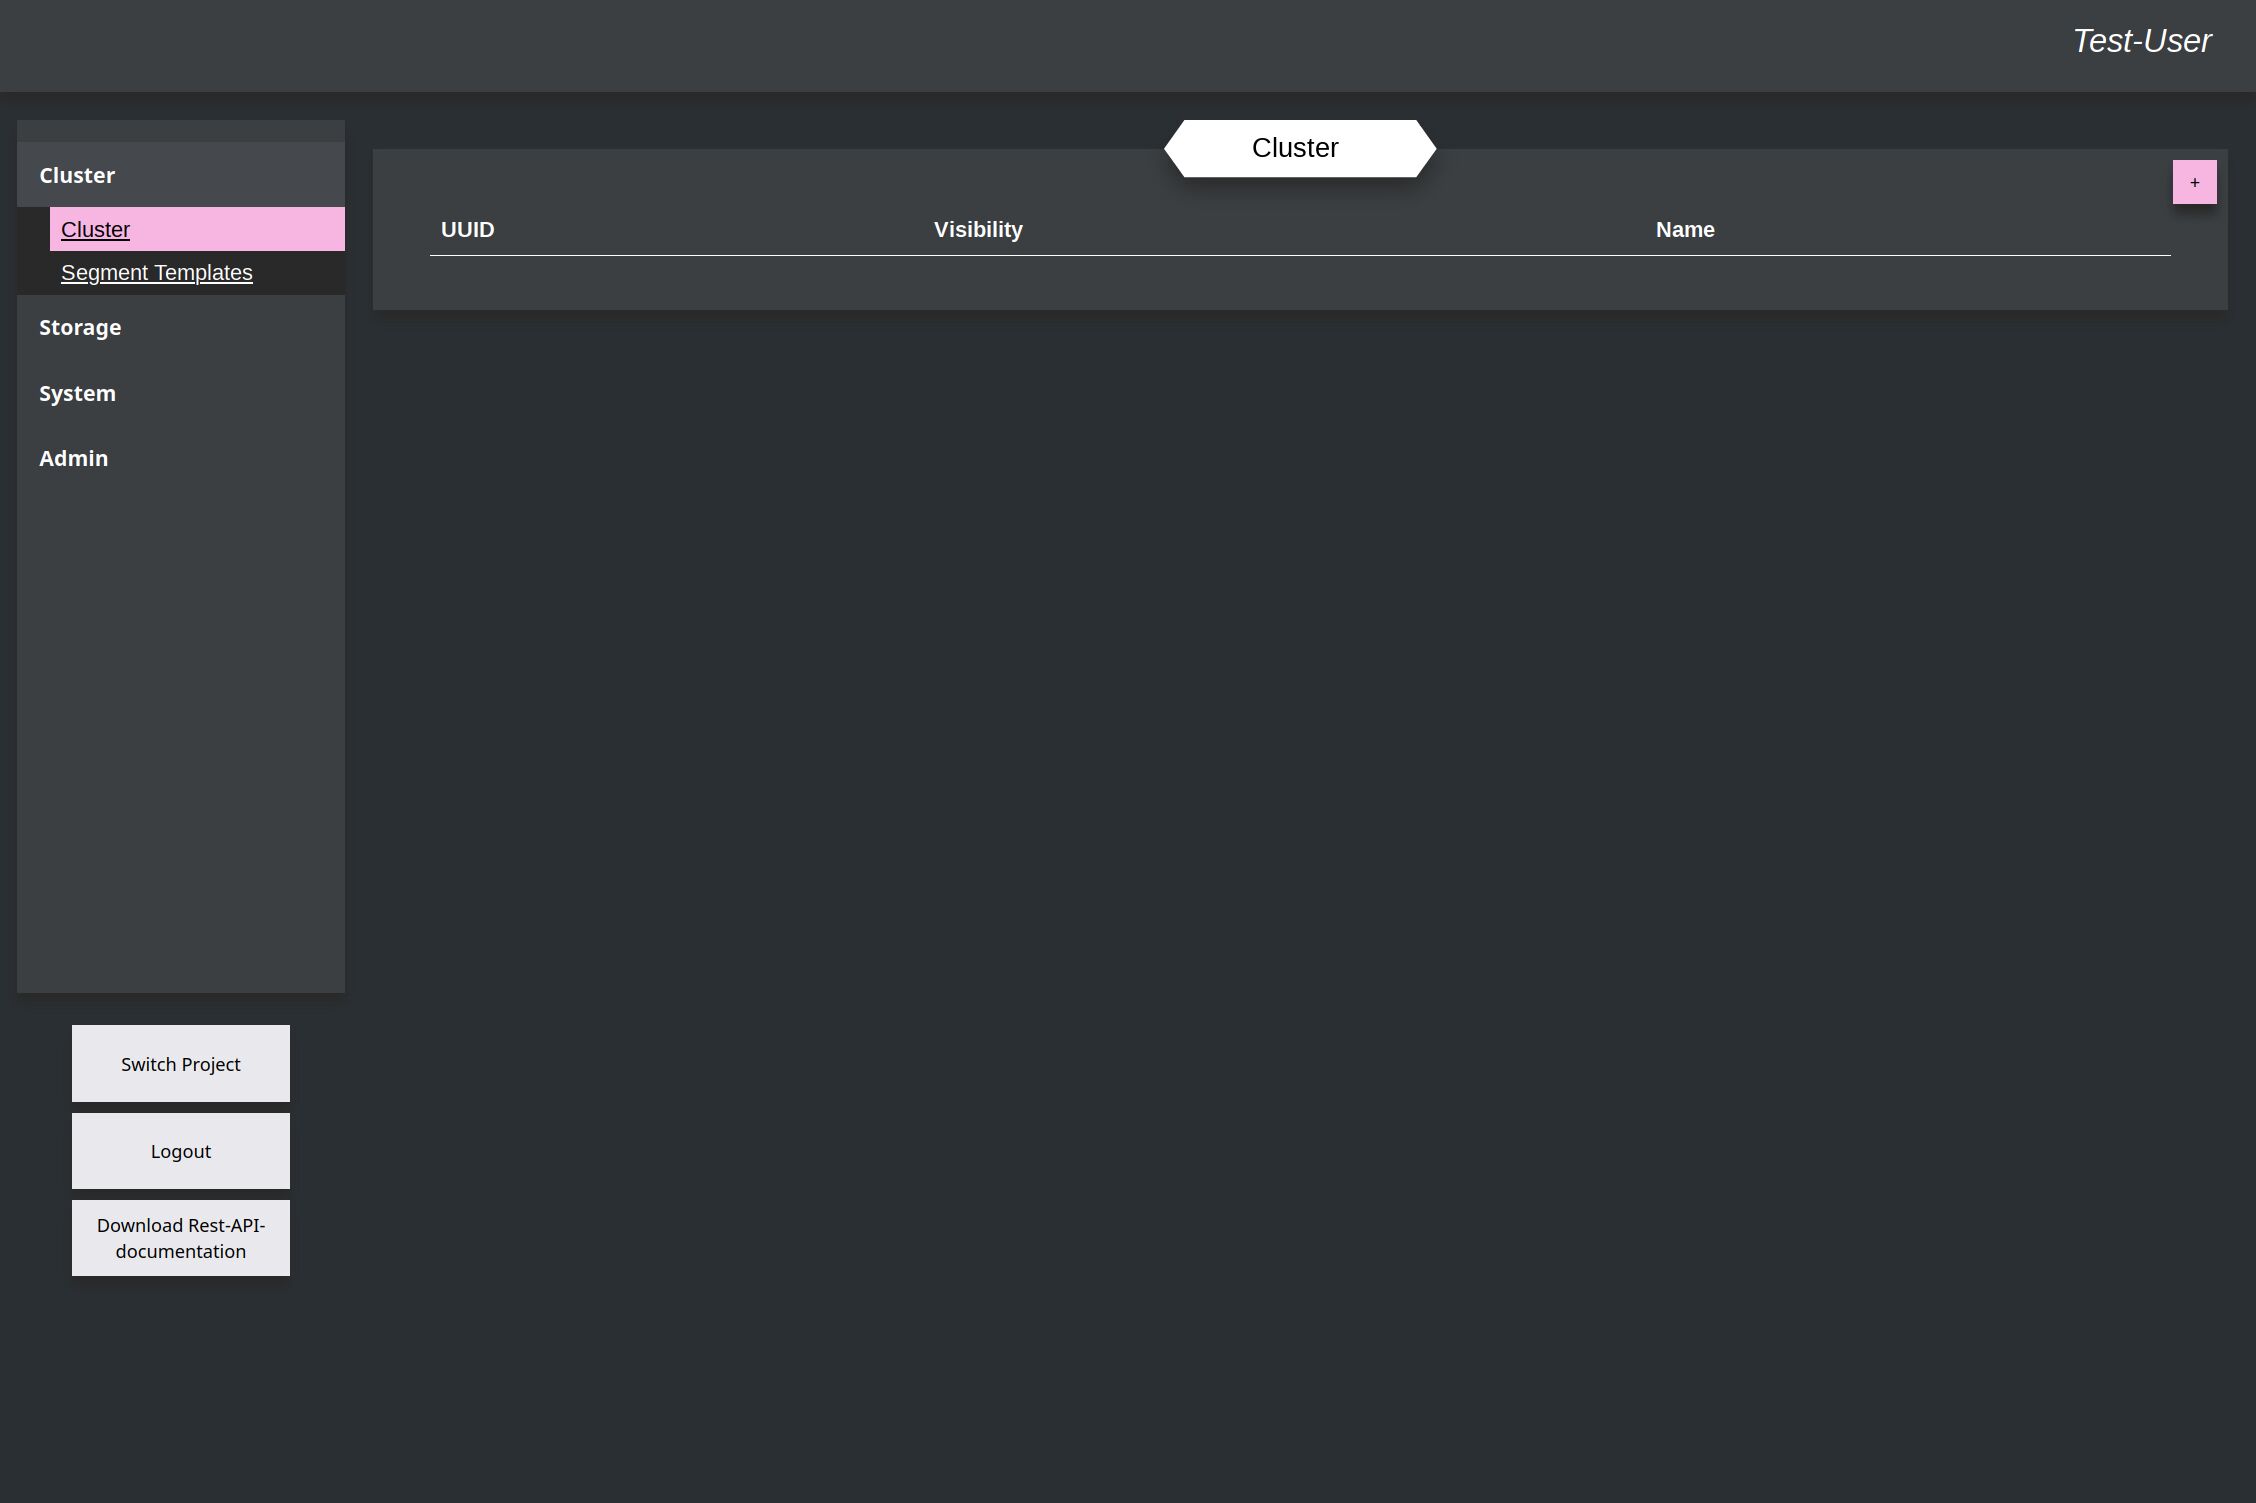
The first you look at after the login is the cluster-overview, which is in this case still empty. On the left side there are the different sections. The Cluster-section contains interactions with Kyouko, the Storage-section the interactions with Shiori, System-section interactions with Azuki and Admin-section everything for Misaki.
Upload Data-Set
The first step is to upload a data-set with data, which will be the input for the network. In this example a table in form of a CSV-file is used.
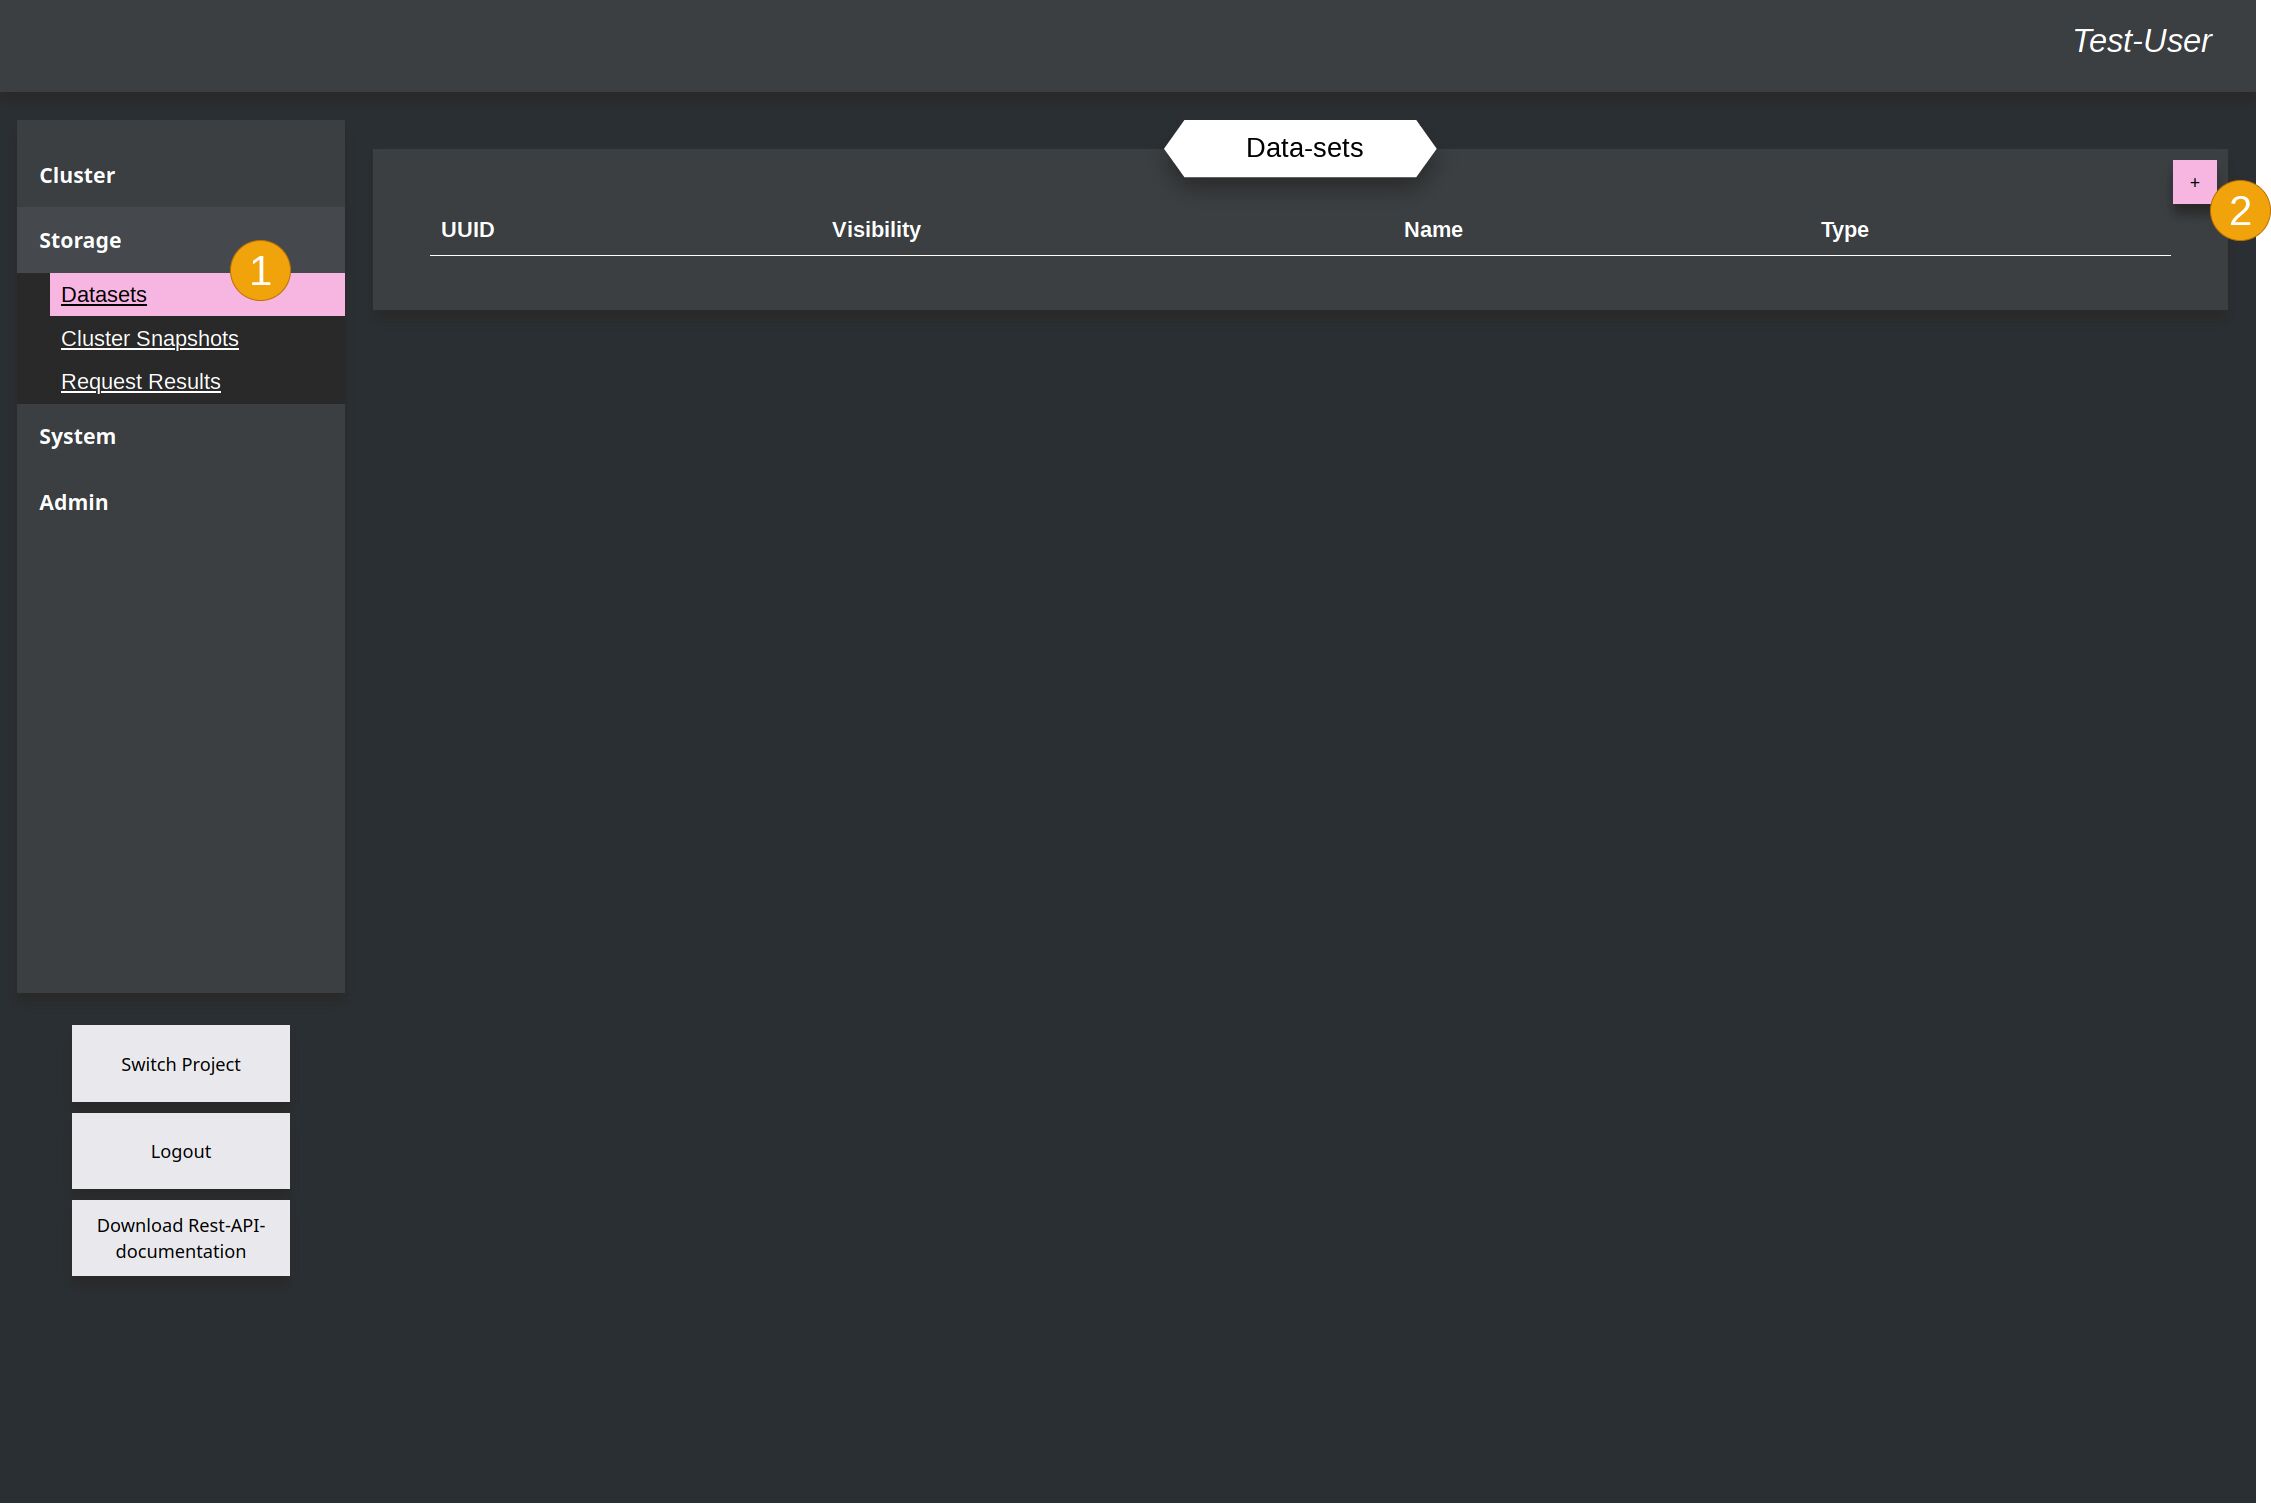
On the left side you have to select the Storage and within this section the Datasets (1). You switch to the overview of data-sets, which is also still empty at the moment. To upload a new file you have to click in the upper right corner on the add-button (2).
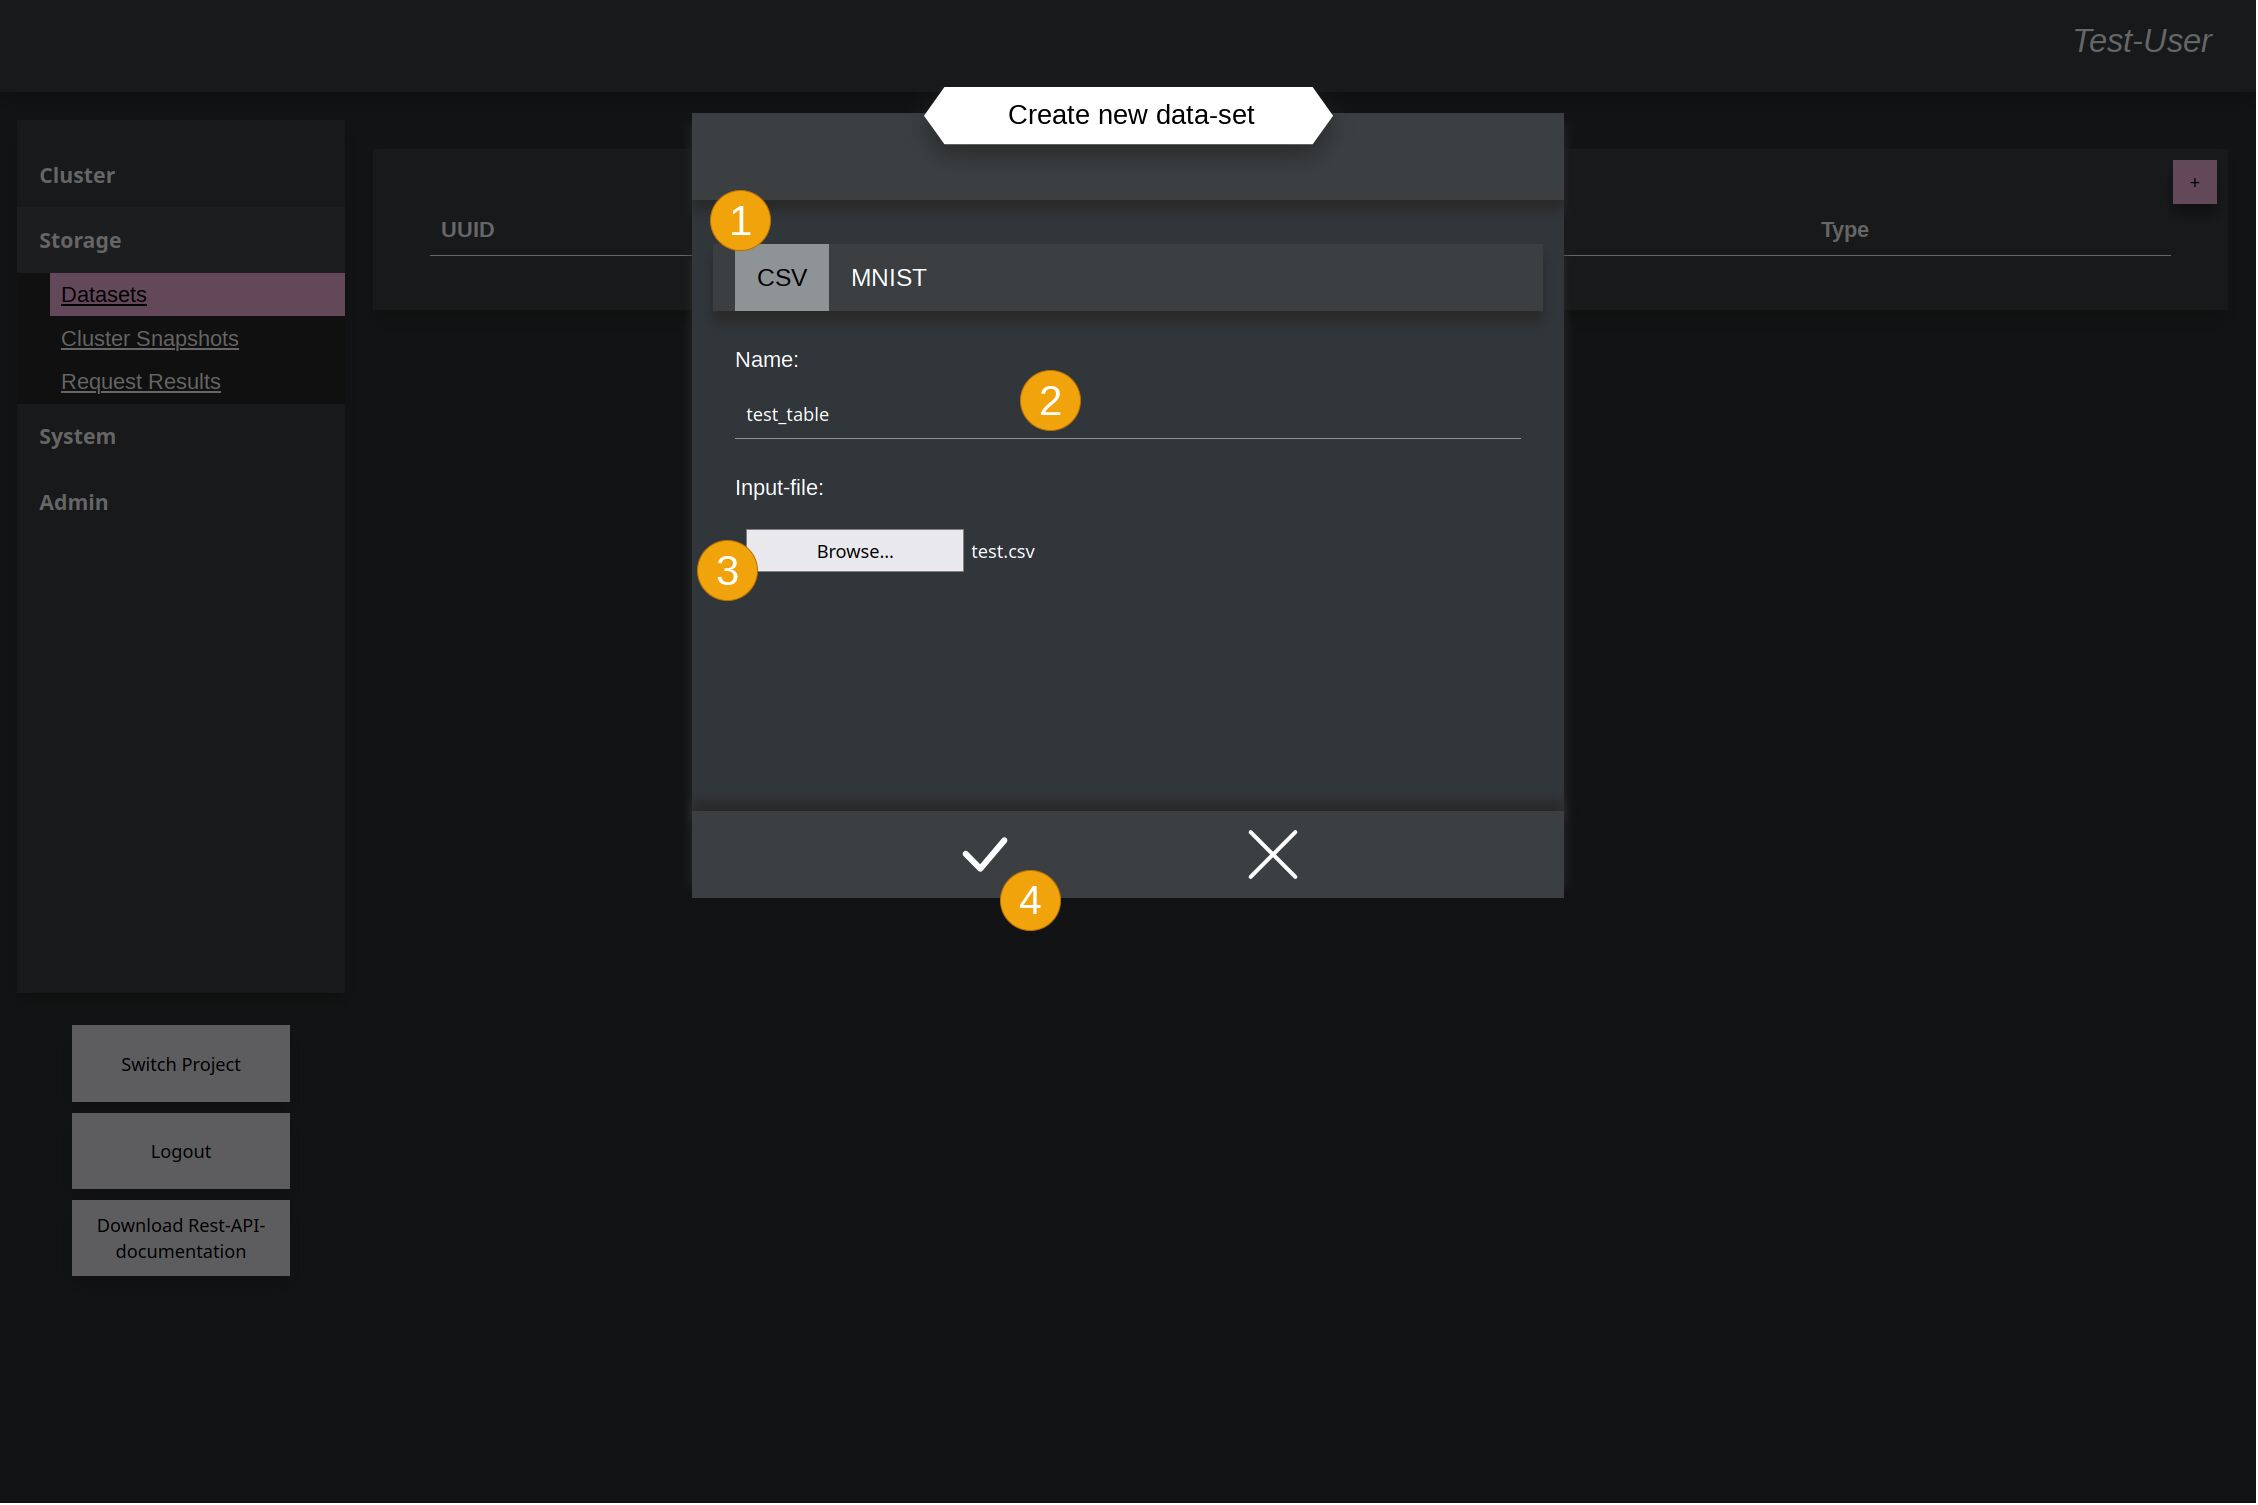
After this a new small window opens. There, in this example the CSV (1) has to be selected in order to upload a csv-file and give it a name for later identification (2). Then over the file-chooser (3) the file has to be selected. The single values within the CSV-file must be separated by ,. At the end accept it (4) to upload the file.
Example
For this example workflow here, this Example-file was used and uploaded, and looks like this
Example
Addtional there is this Example-file for testing of the trained network.
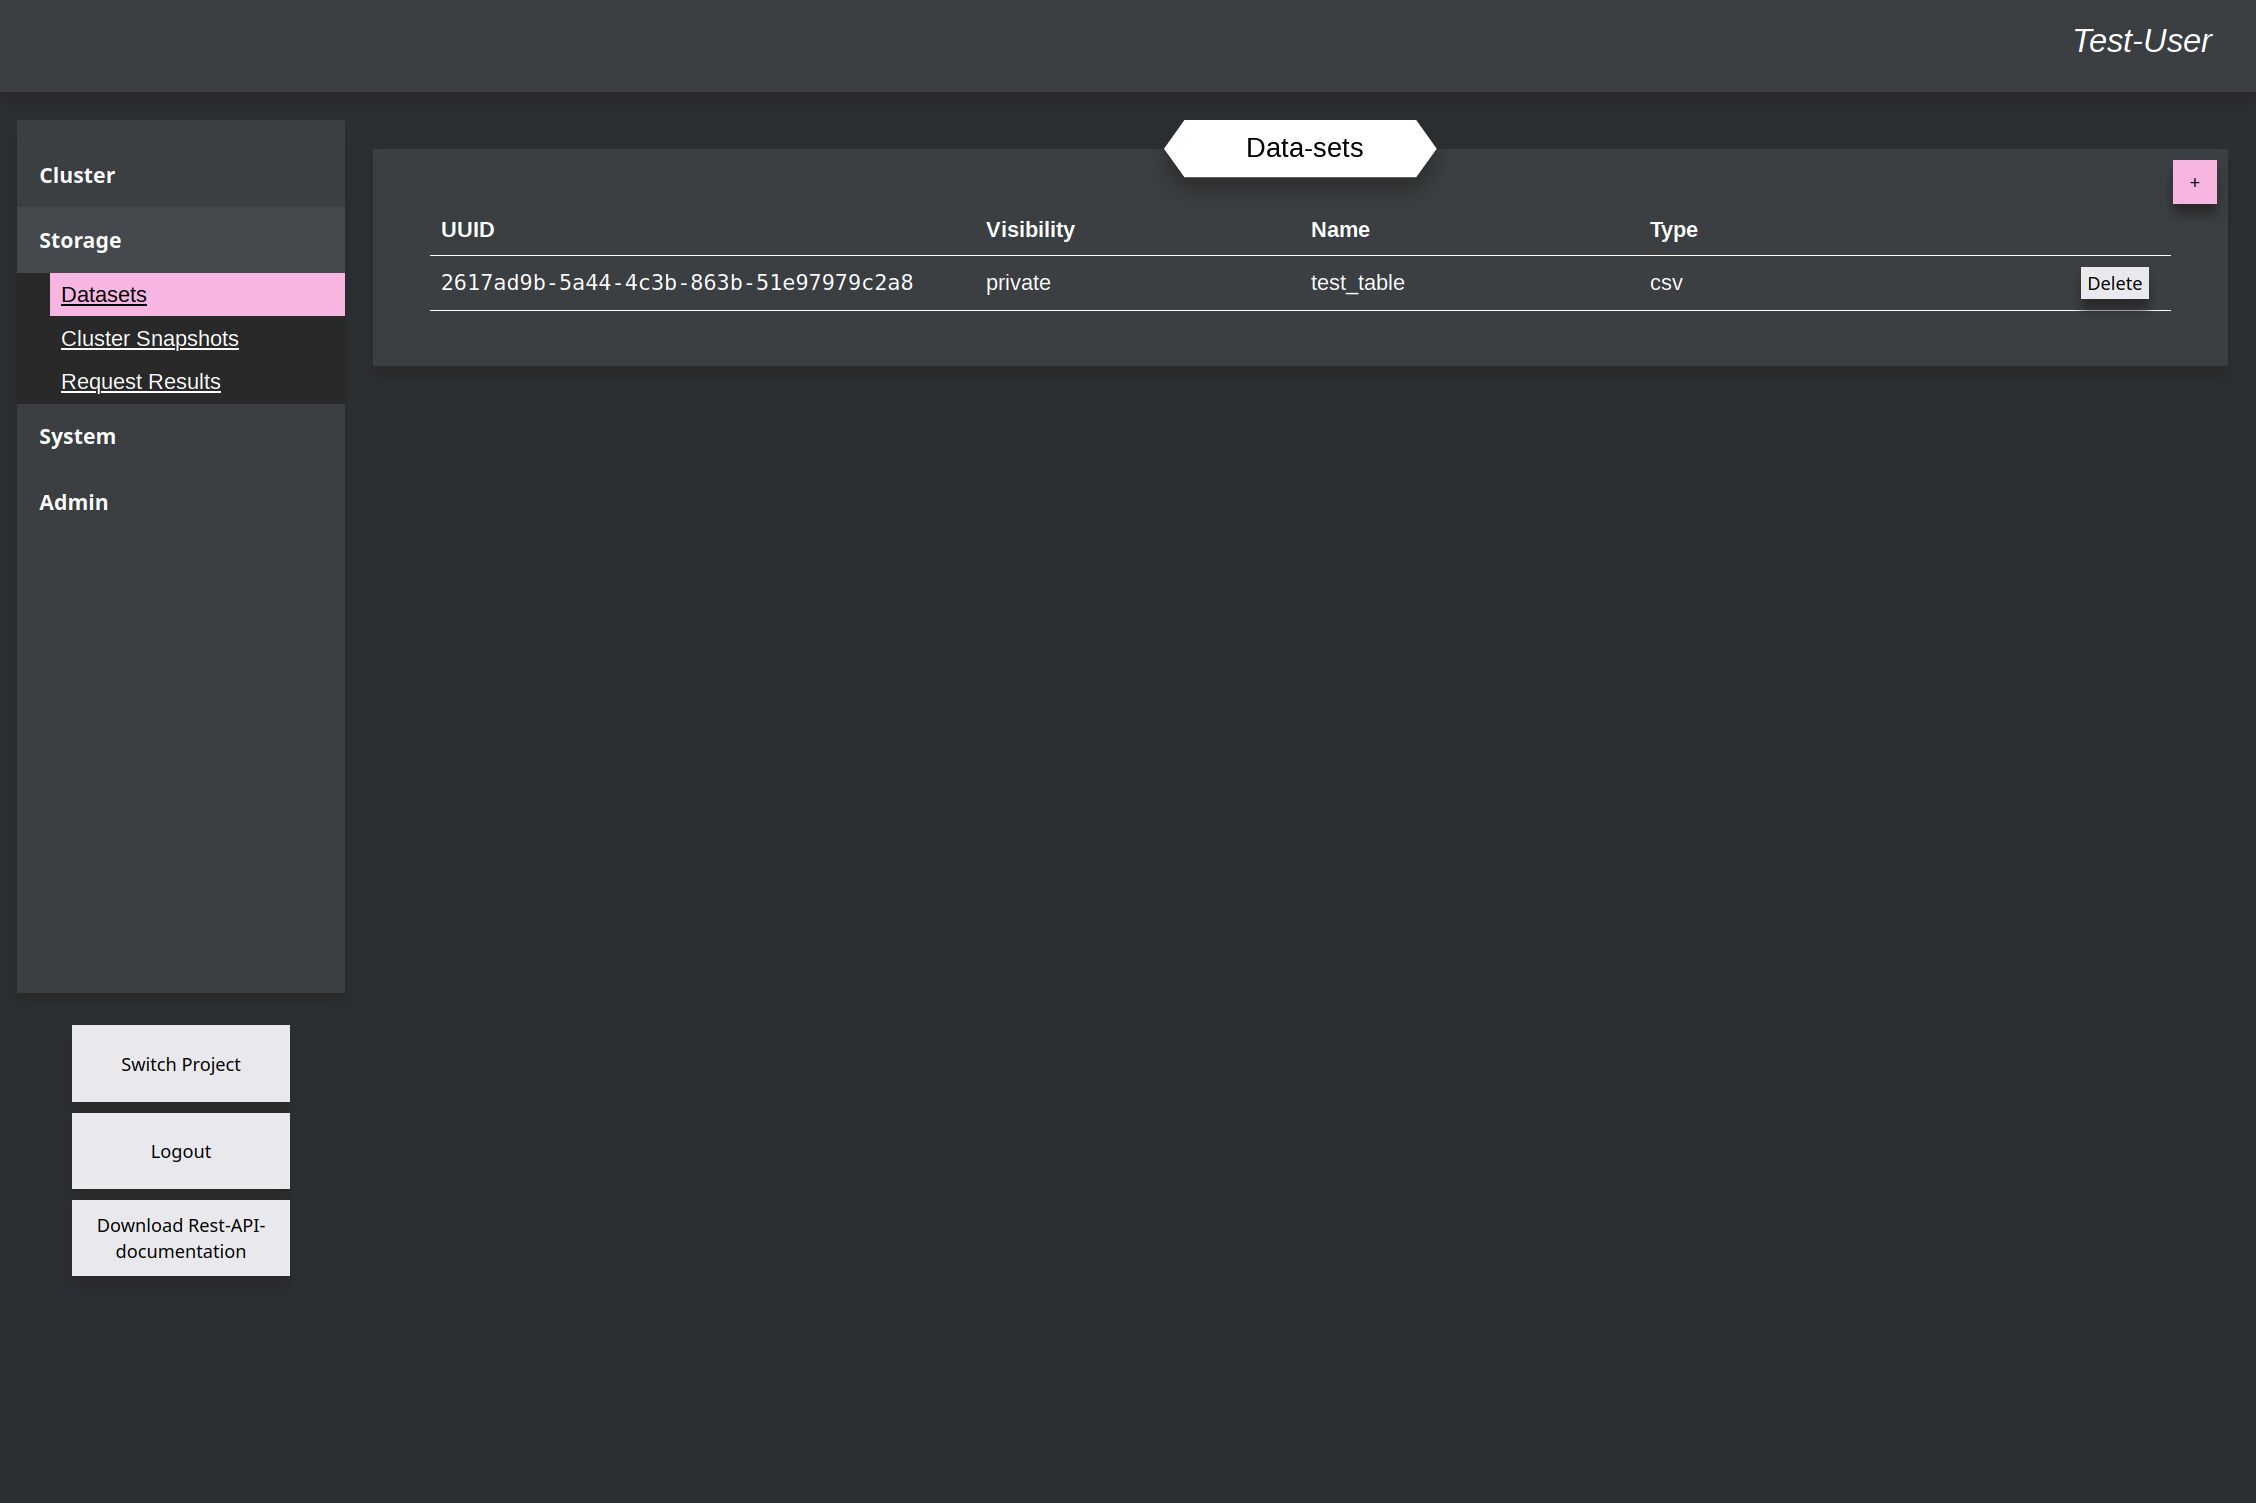
The window is still open, until the upload is finished. This will be fixed later with progress-bar for better feedback. After this the new uploaded file is printed in the data-set-table.
Create Cluster
Next you have to create the cluster itself based on the template.
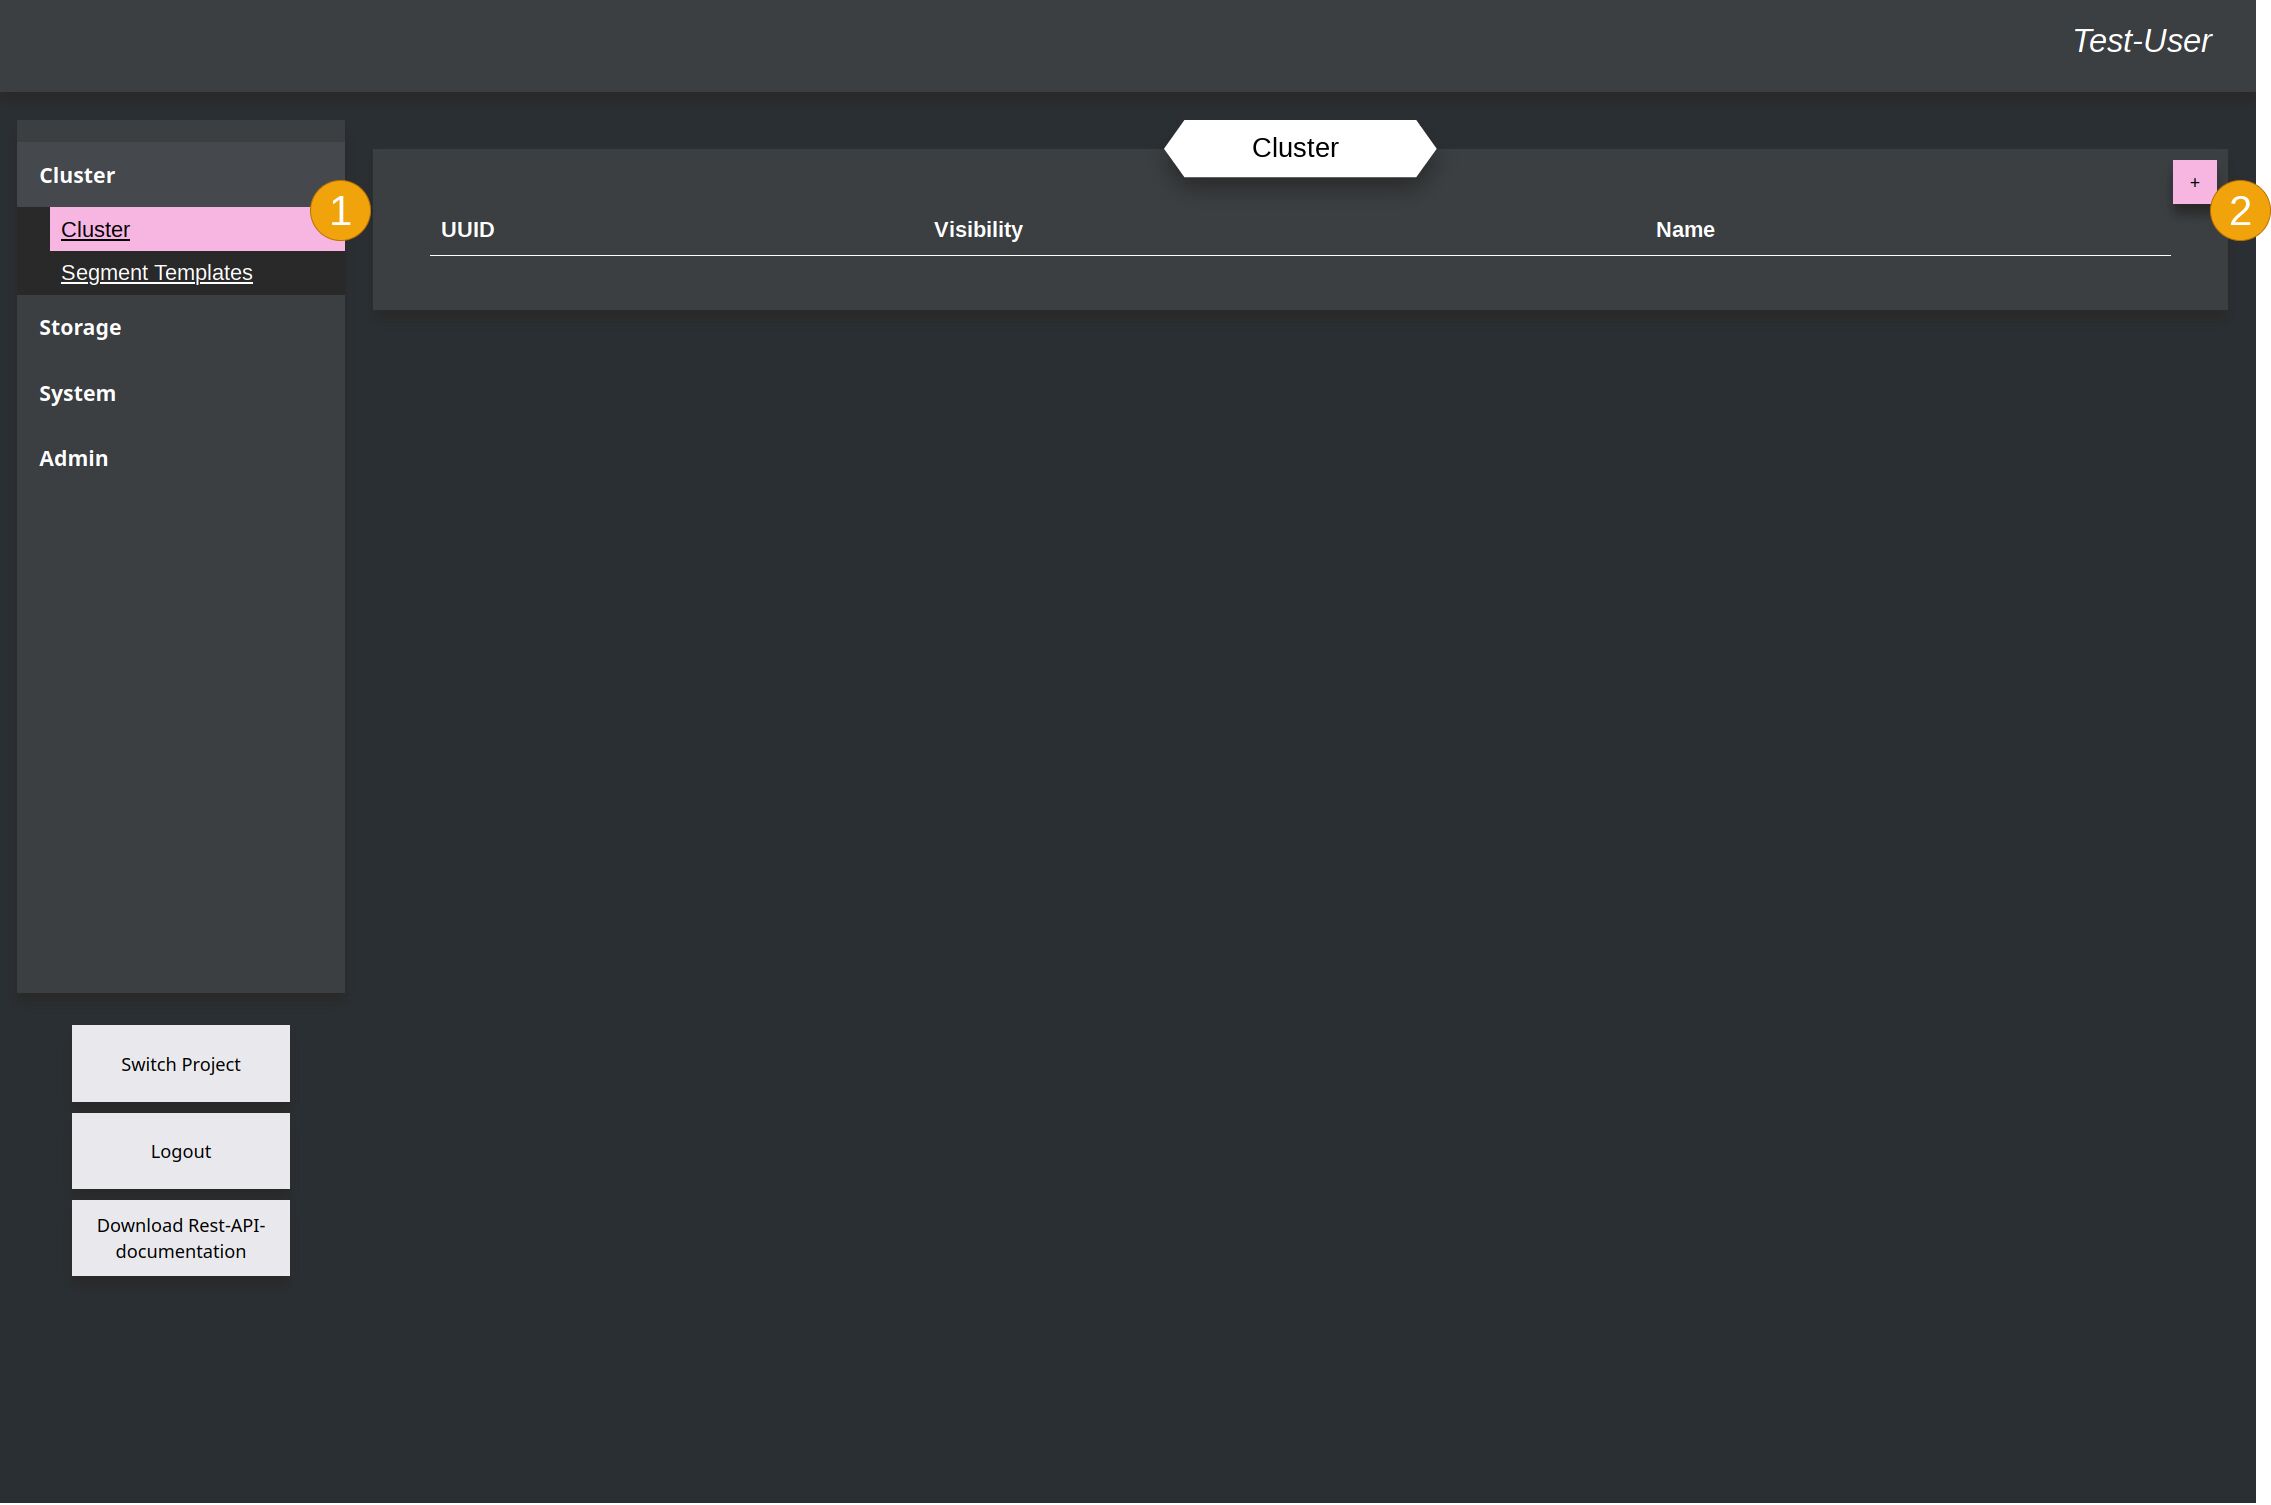
Same procedure: Go to the Cluster chapter (1) and add a new Cluster (2).
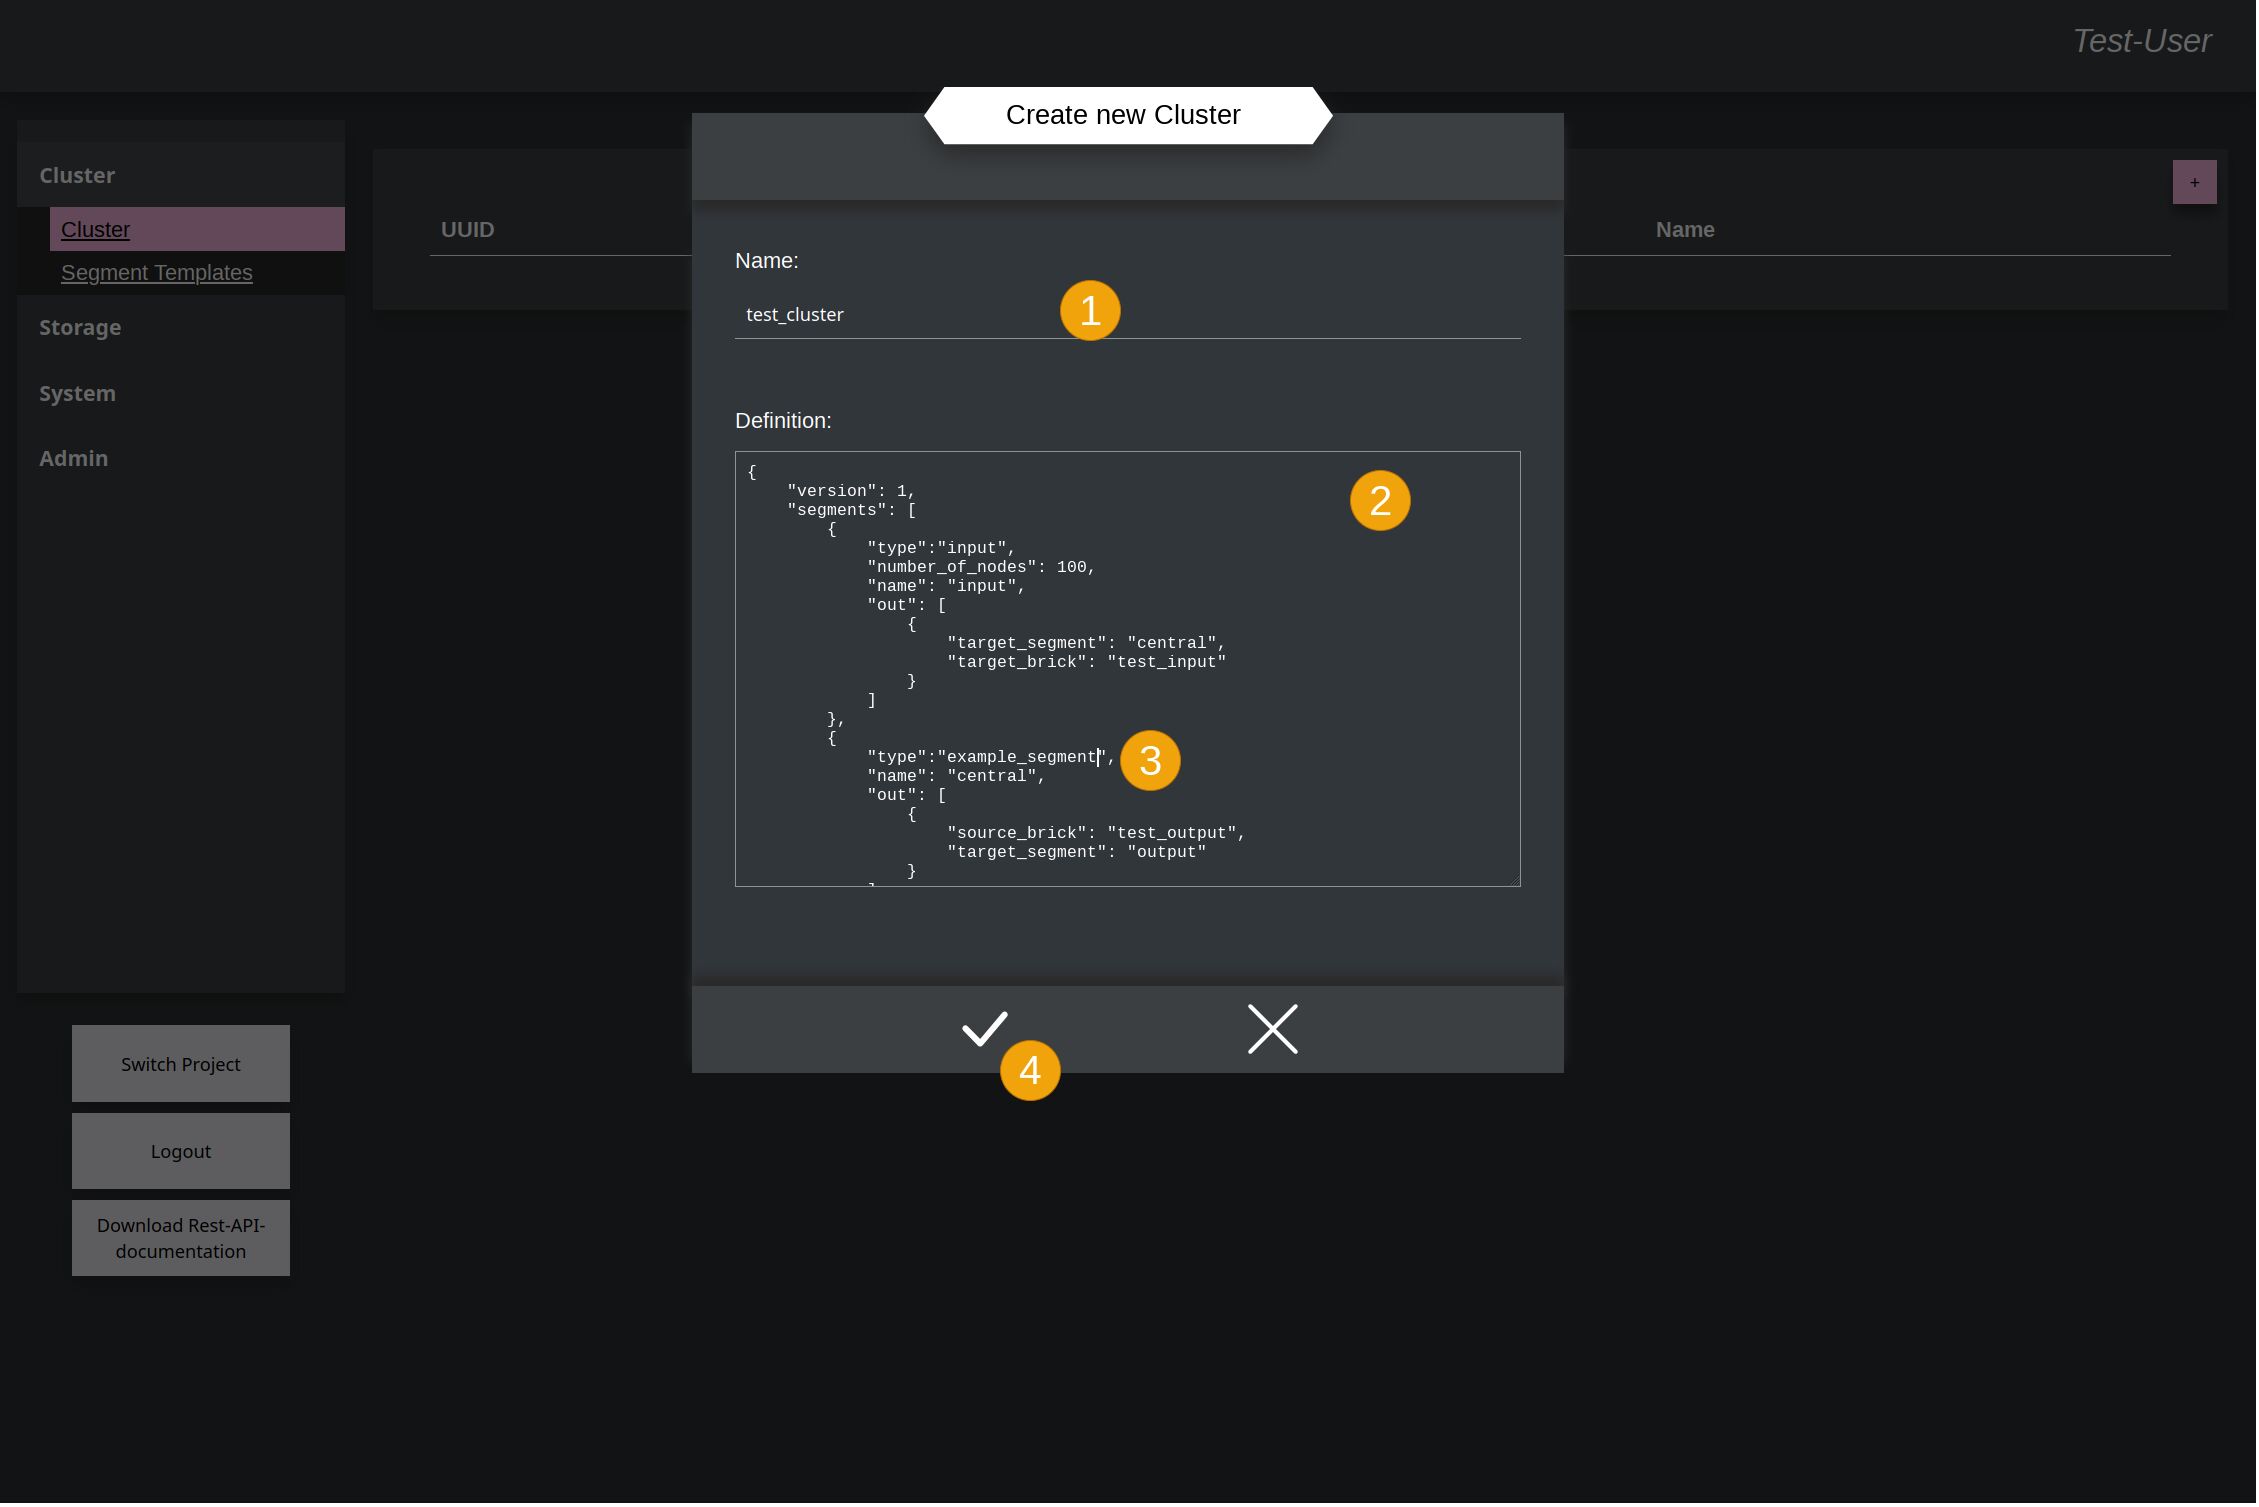
Here you have to give it again a name (1) and a Cluster-Template (2). Within the template the name of the previously uploaded Segment-Template (3) is used as segment for this example Cluster. At the end accept again to create the cluster (4).
See basic explanation of the templates
Example Template
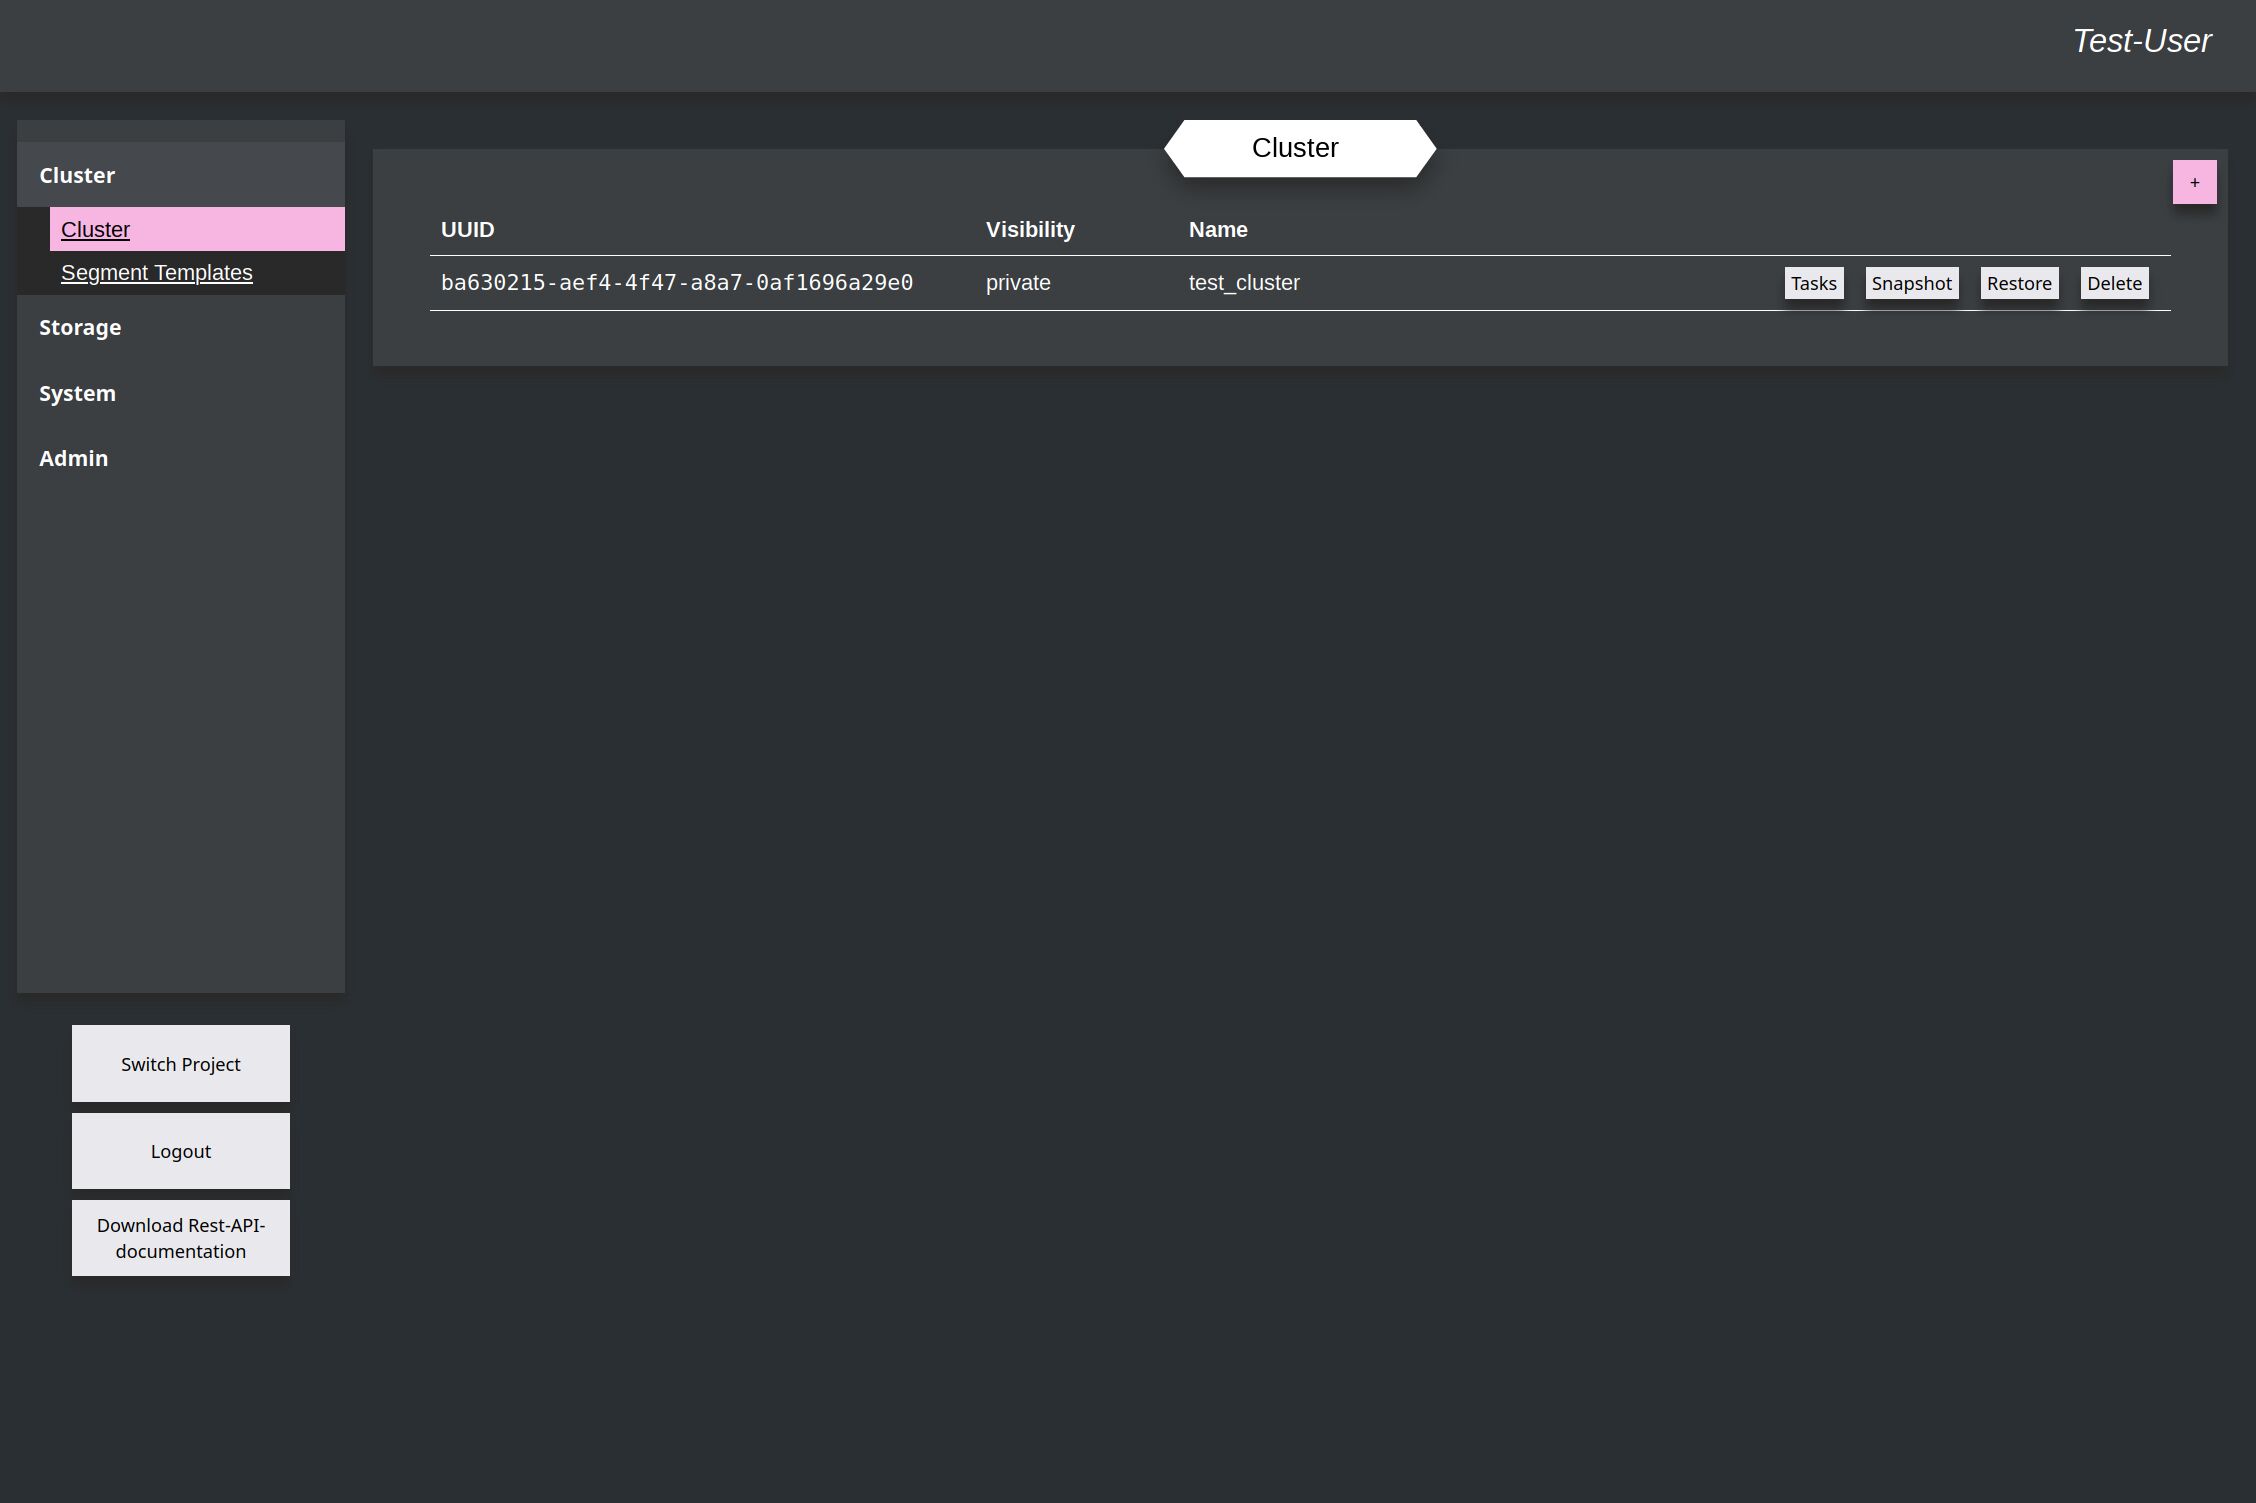
Now the cluster is created in Kyouko and ready to train things.
Create Tasks
DirectIO to directly interact with the cluster over a websocket is not available in the Dashboard. For the dashboard you can only use previously uploaded Data-Sets, which can be given the cluster as task.
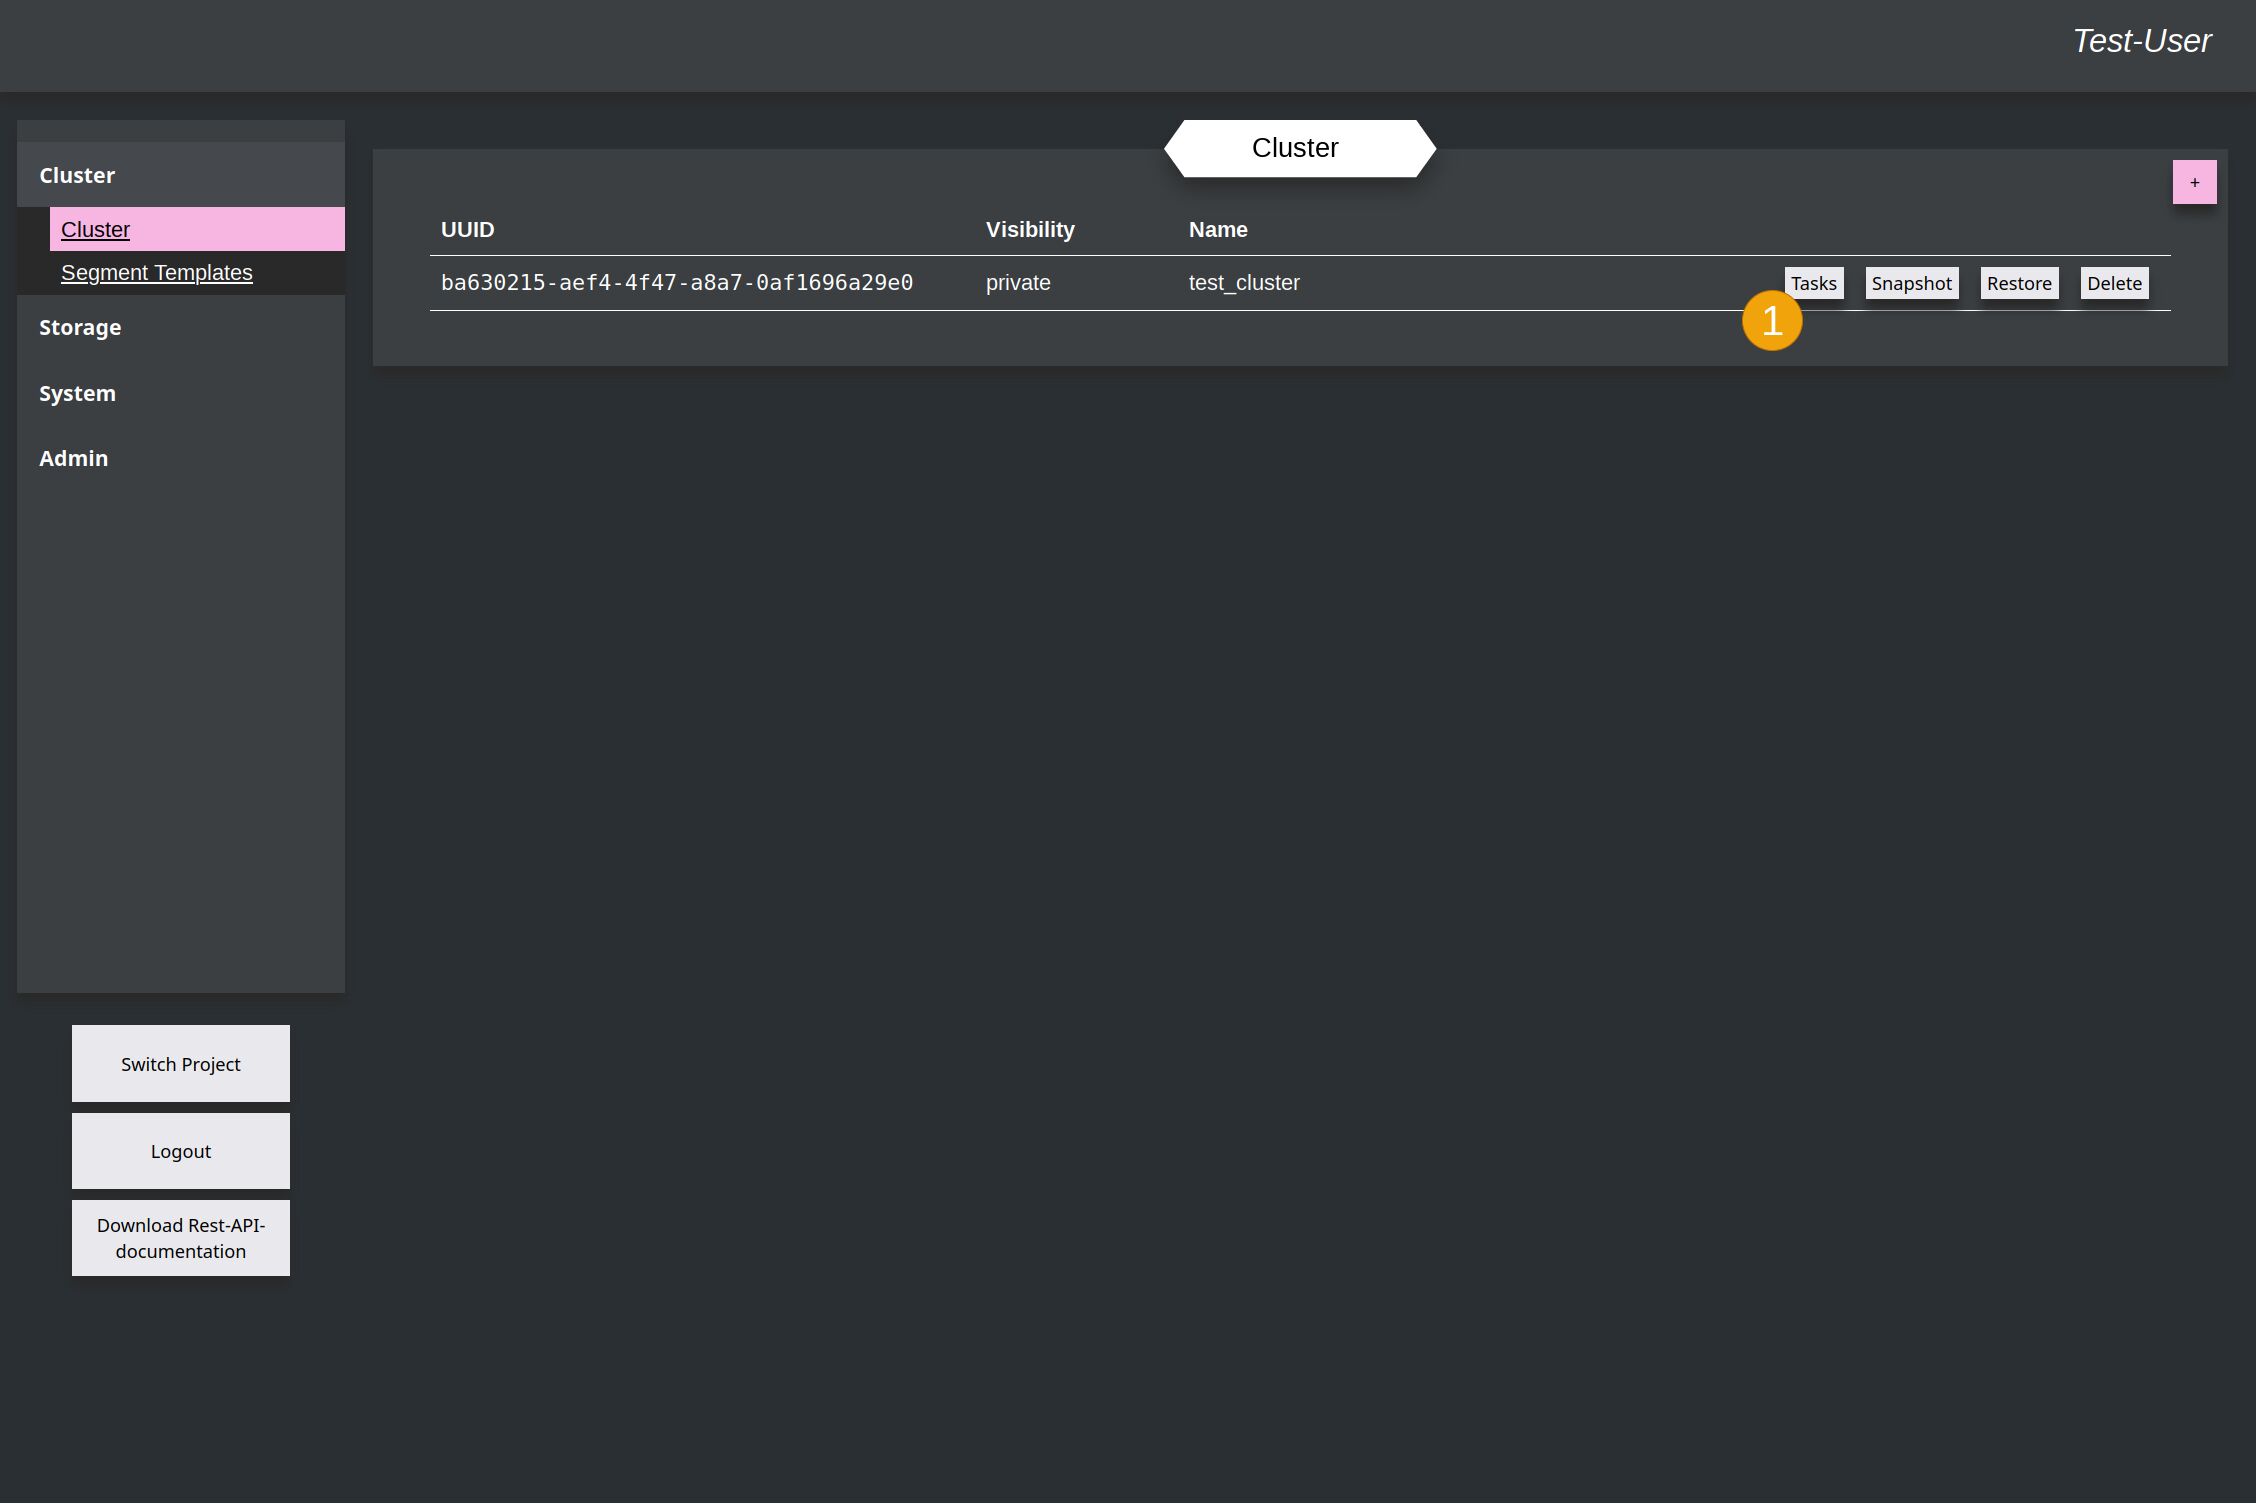
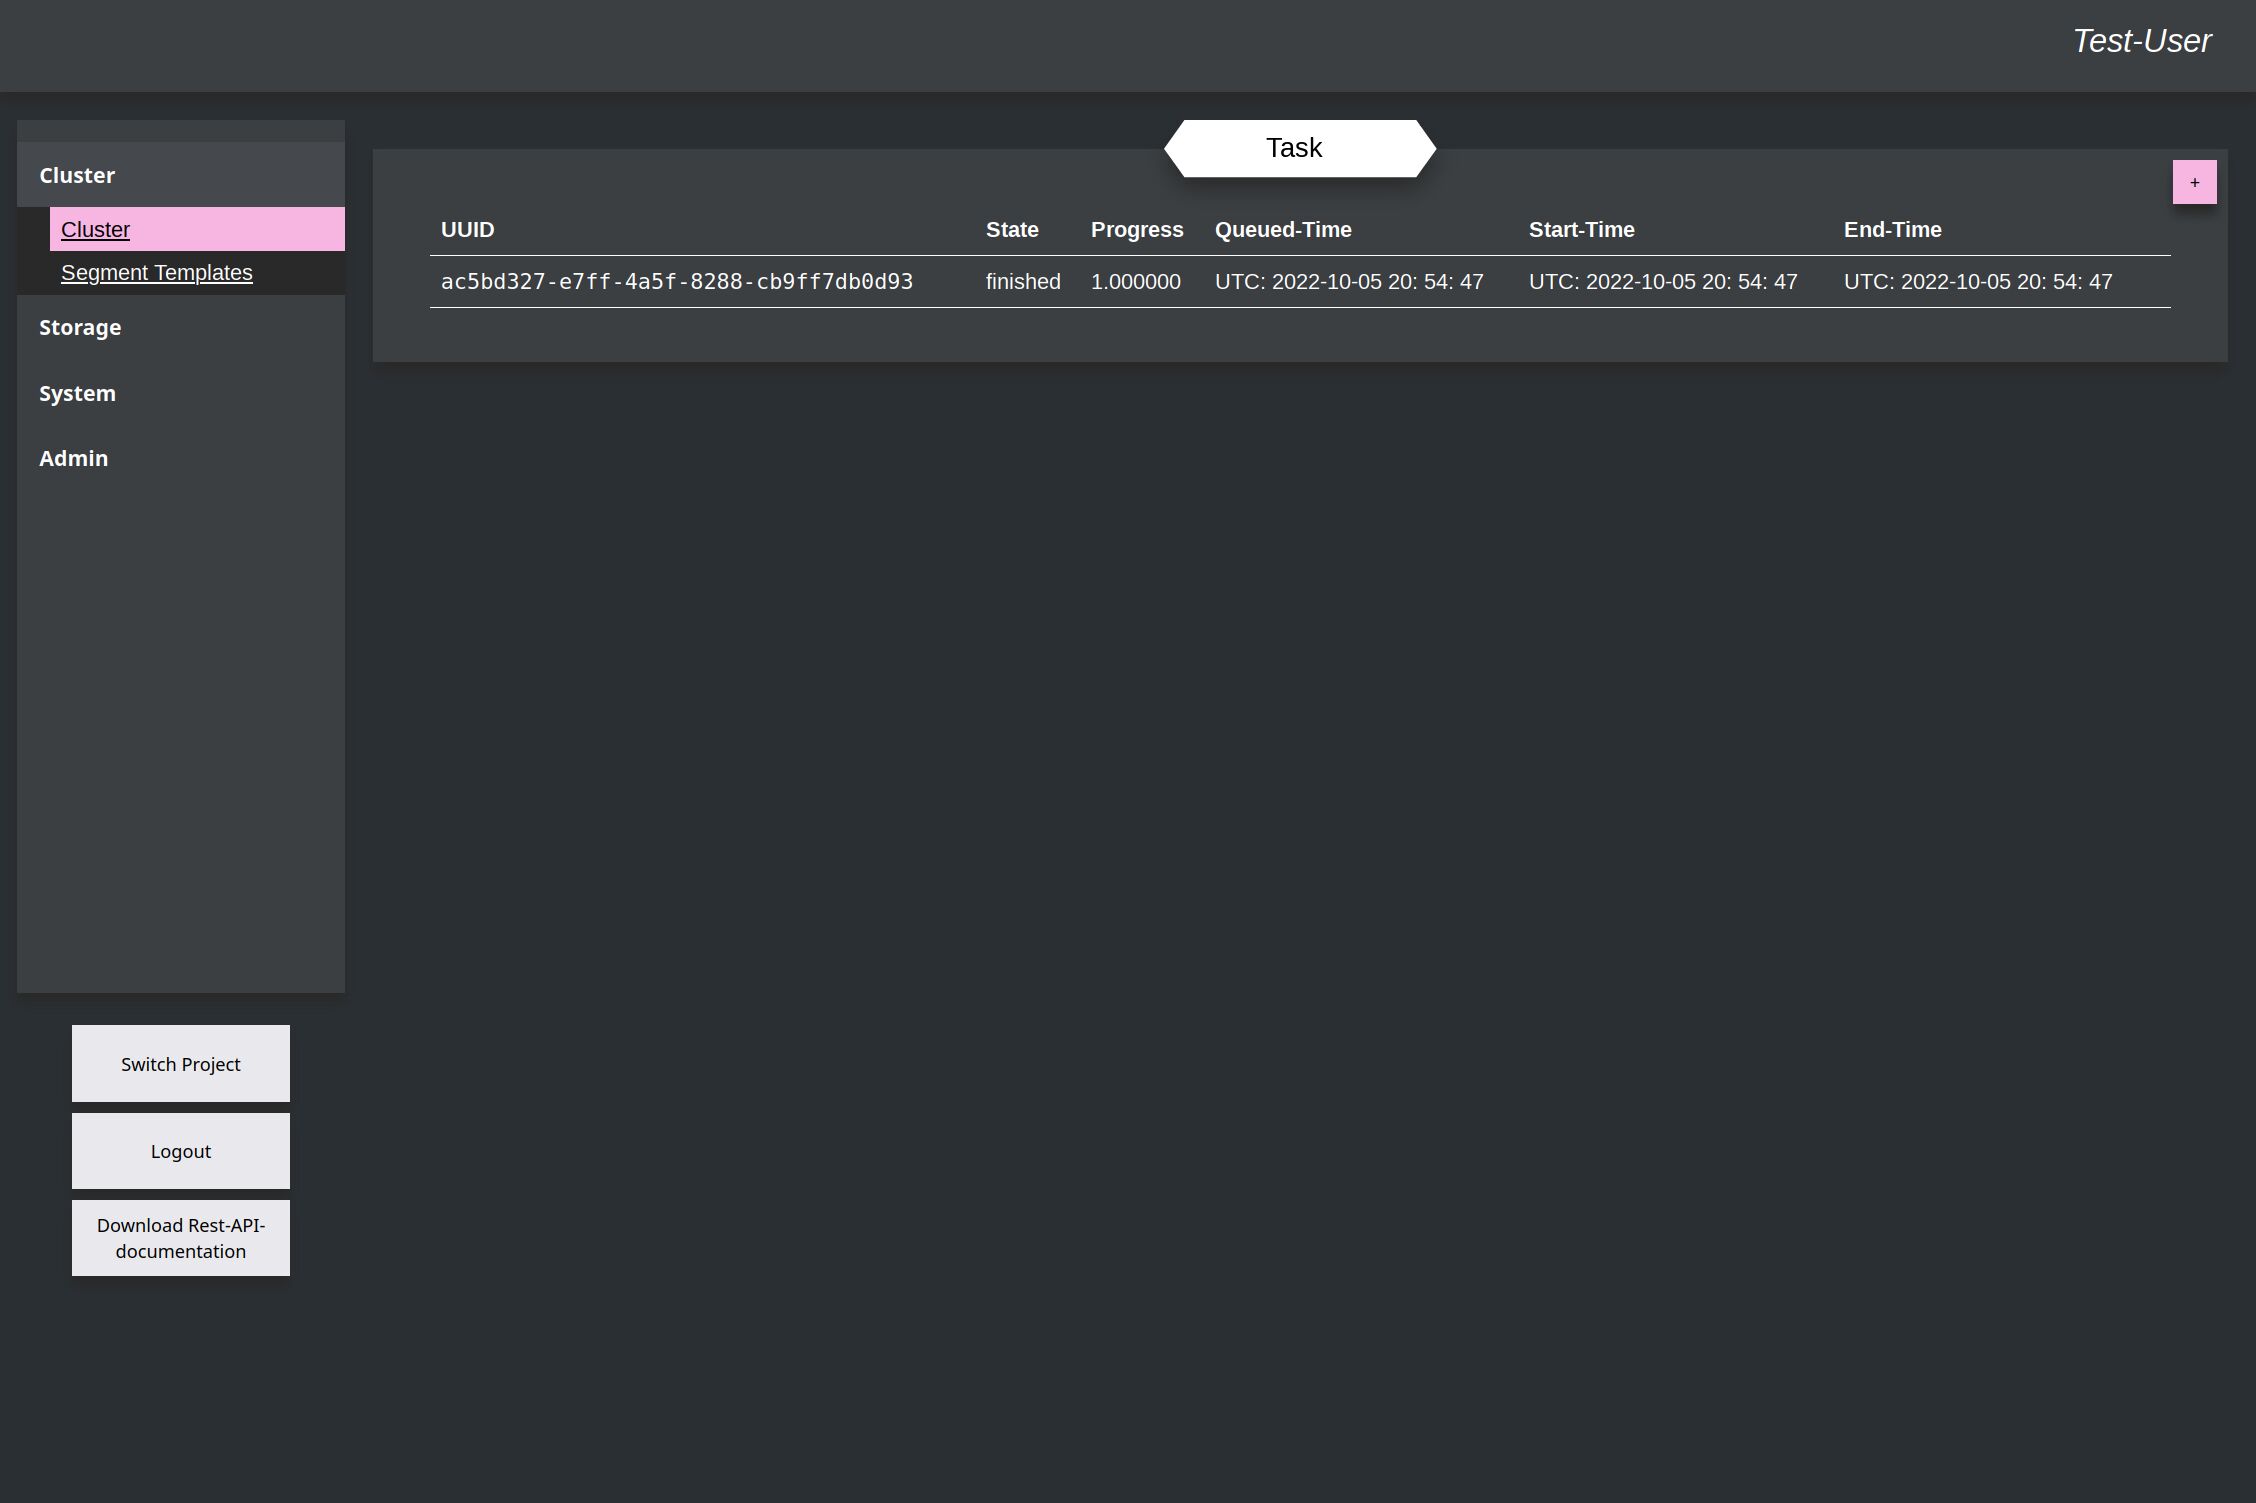
Go to the Task-Overview of the cluster by clicking the button (1).
This switch the window to the overview of all Tasks for the Cluster. With the add-button (1) a new task can be created.
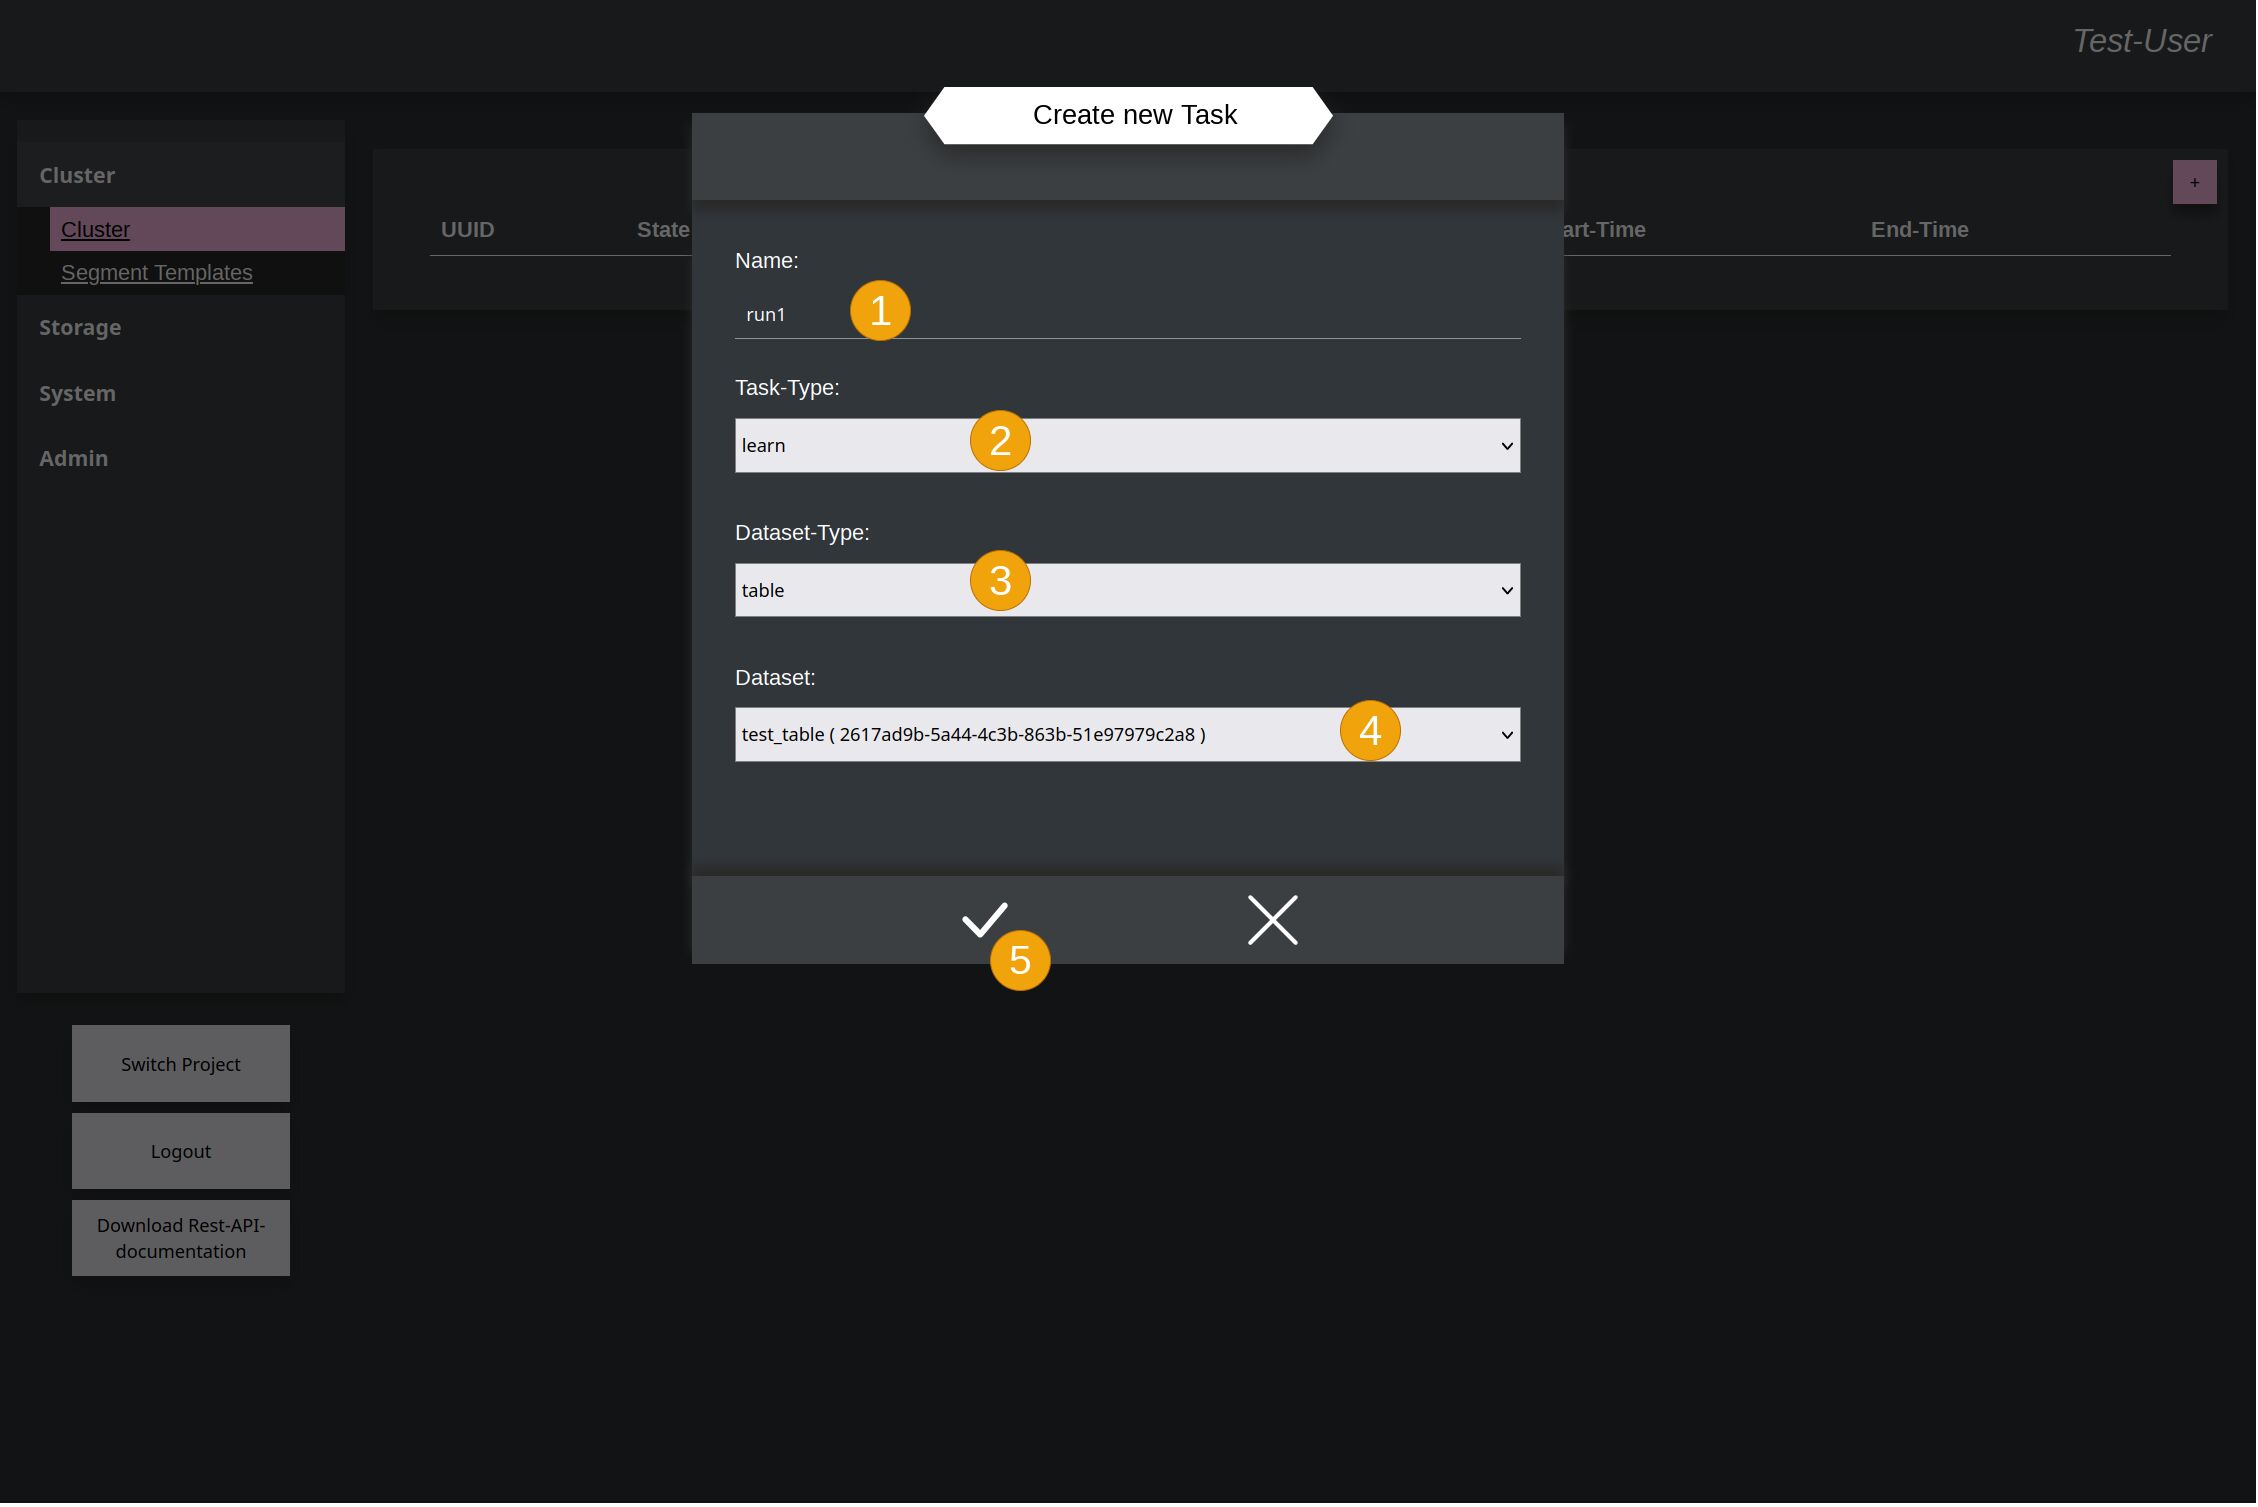
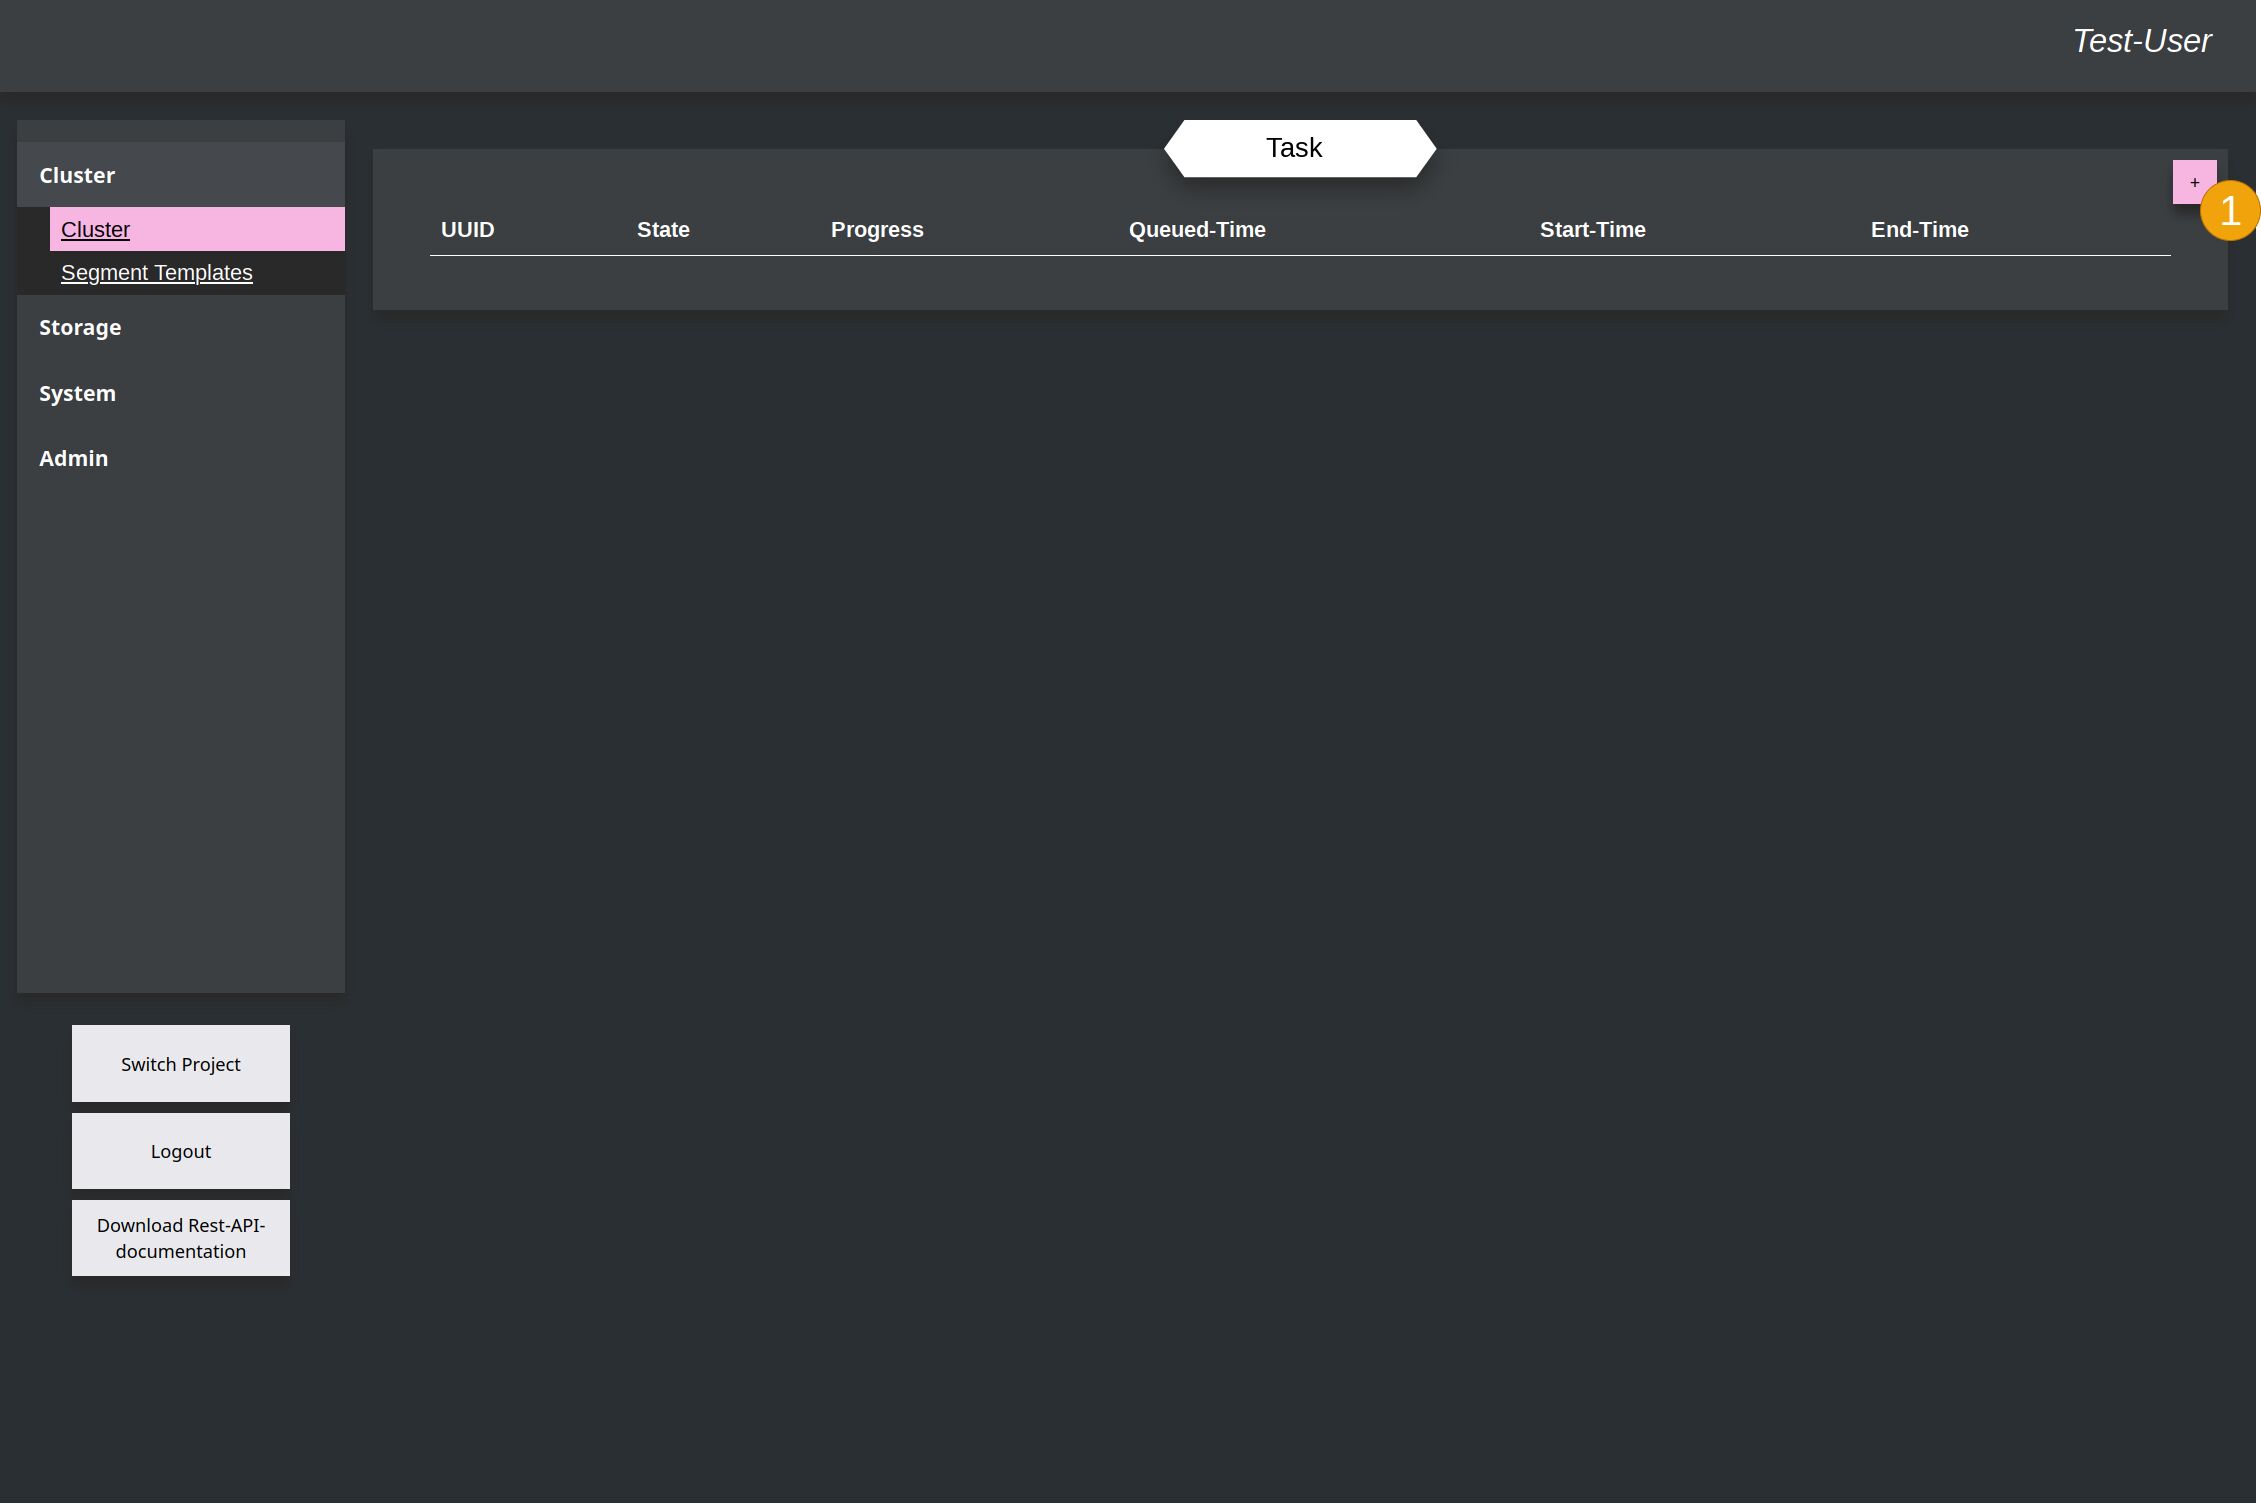
In the new window you can give it a name (1) and say that the cluster should train data (2). (3) is deprecated and not necessary anymore. The type of the dataset doesn't have to be explicit specified.
Then select the data-set in the dropdown menu (4) and accept again (5).
After this it switch back to the overview of the tasks, where the new one appears, with progress and timestamps. Because the example is really small, all timestamps here have the same value, because everything runs through in the same second.
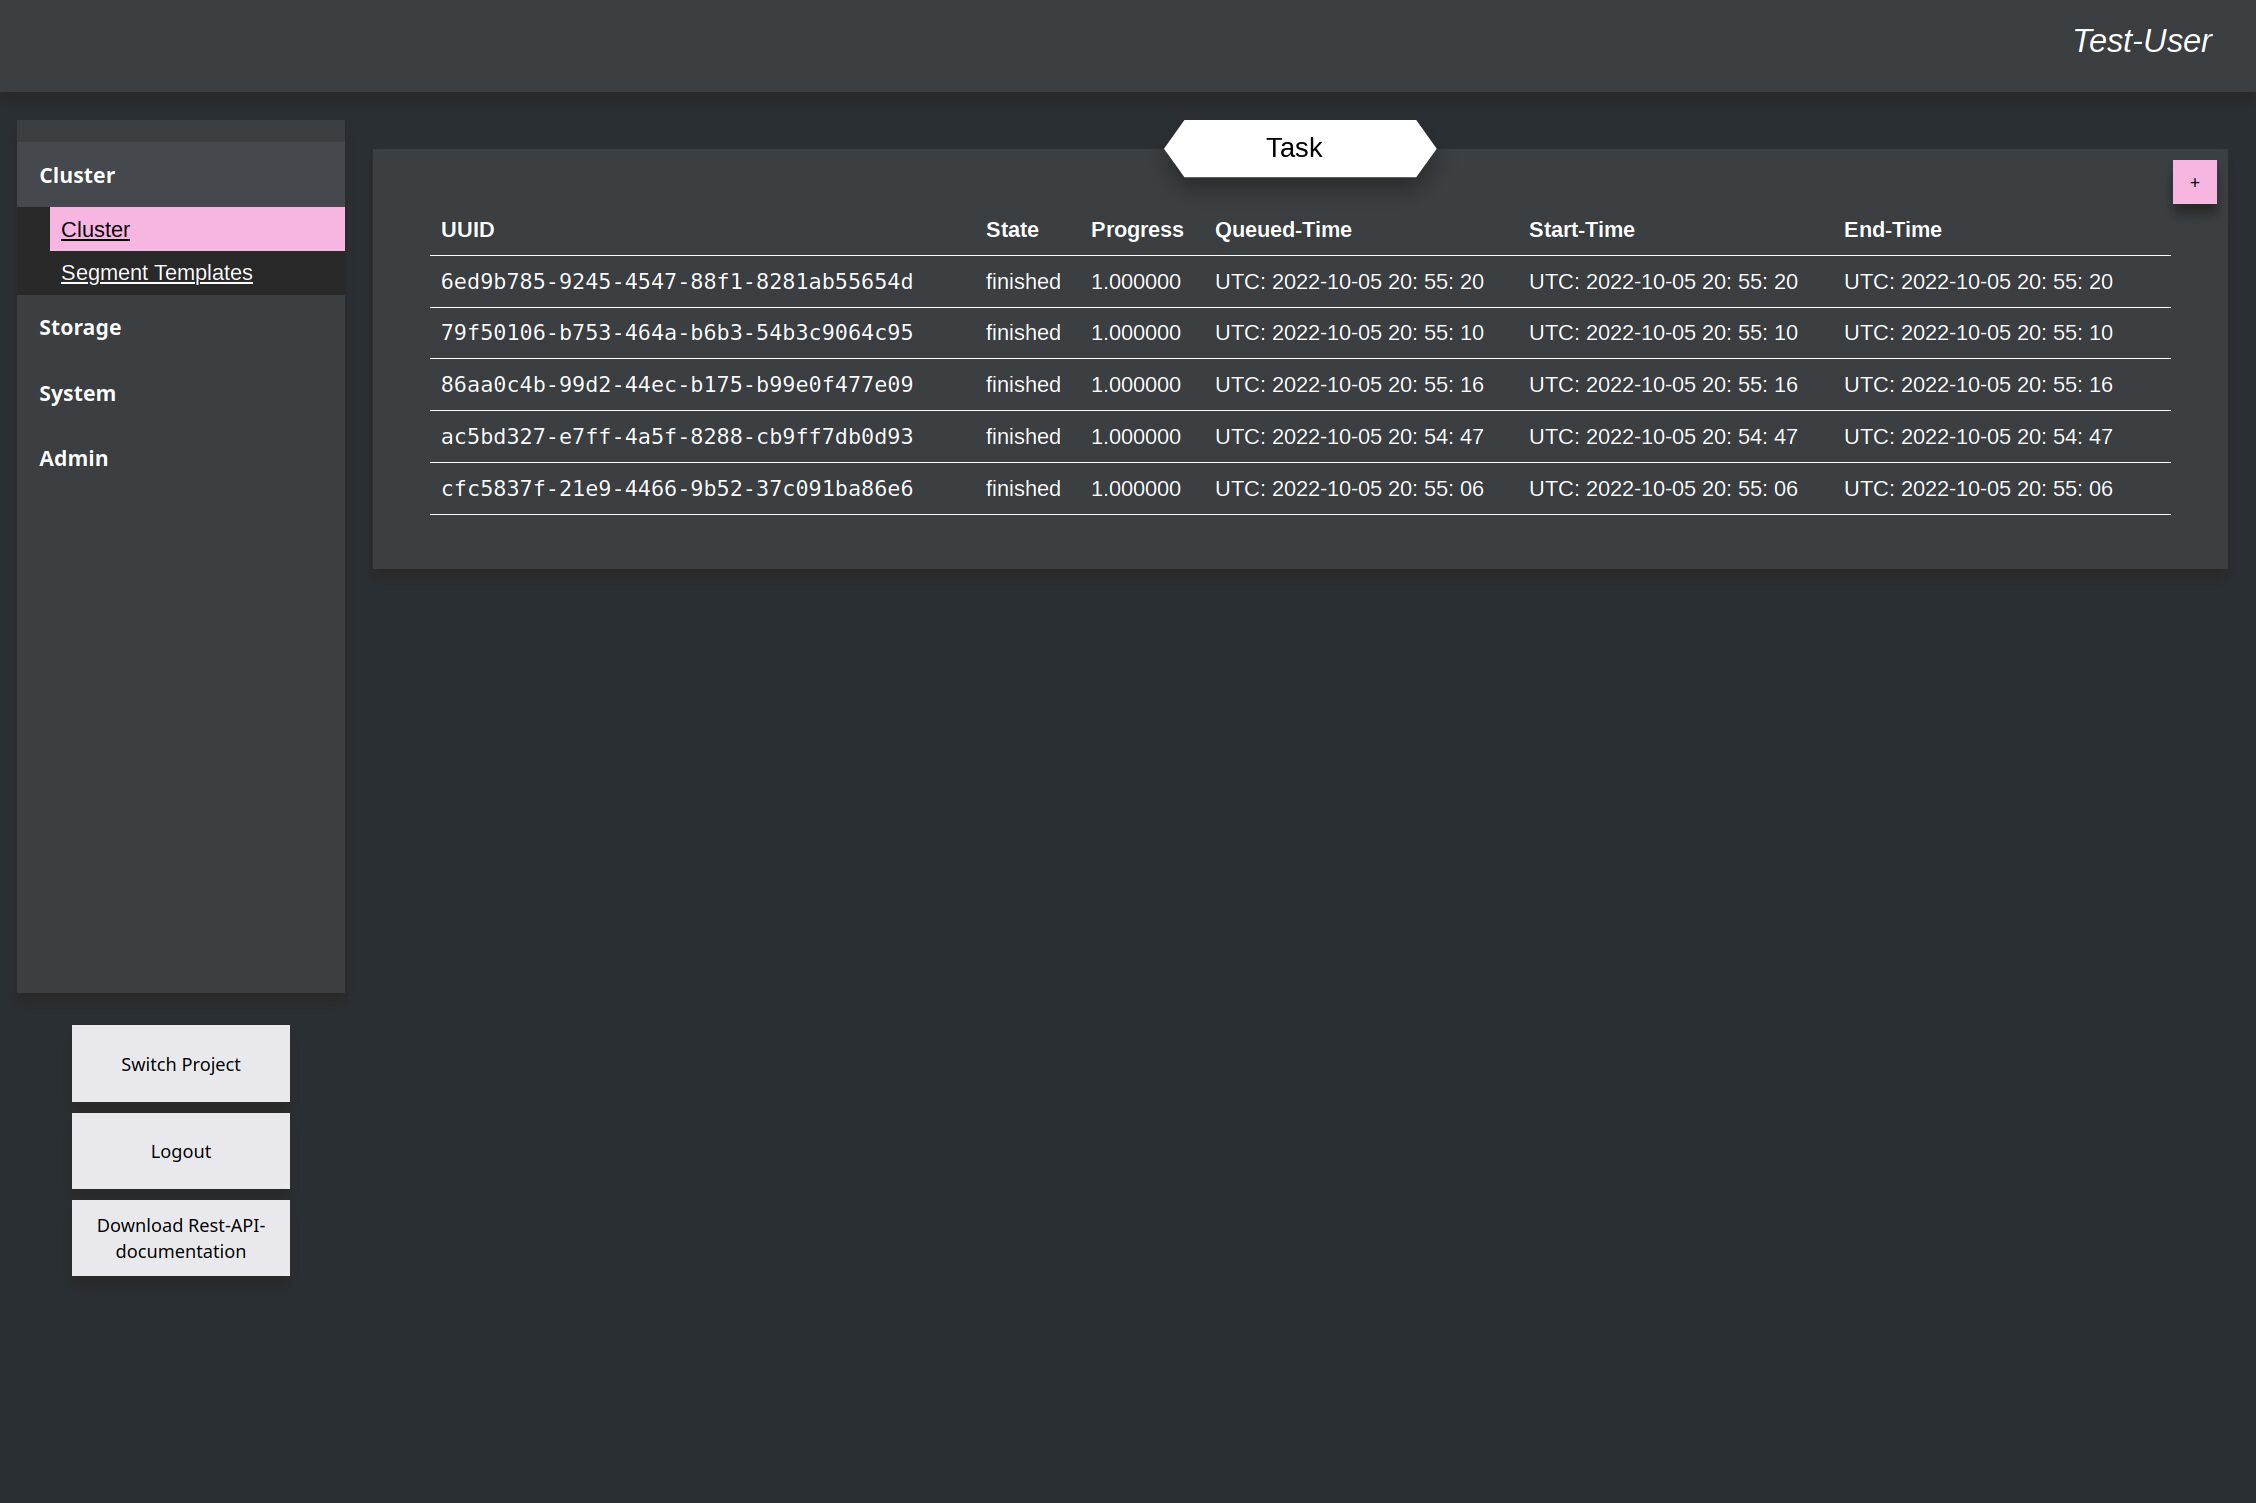
After this a few more of the same task can be created to improve the train-result.
Note
With version 0.3.0 it will be also possible to define multiple runs to avoid this manually created of multiple tasks. Originally this project was only developed with the SDK-library and Tsugumi as test-tool, where multiple tasks can easily created with a for-loop. So this user-impact only appeared in the Dashboard, which is the reason, why it is at the moment like it is.
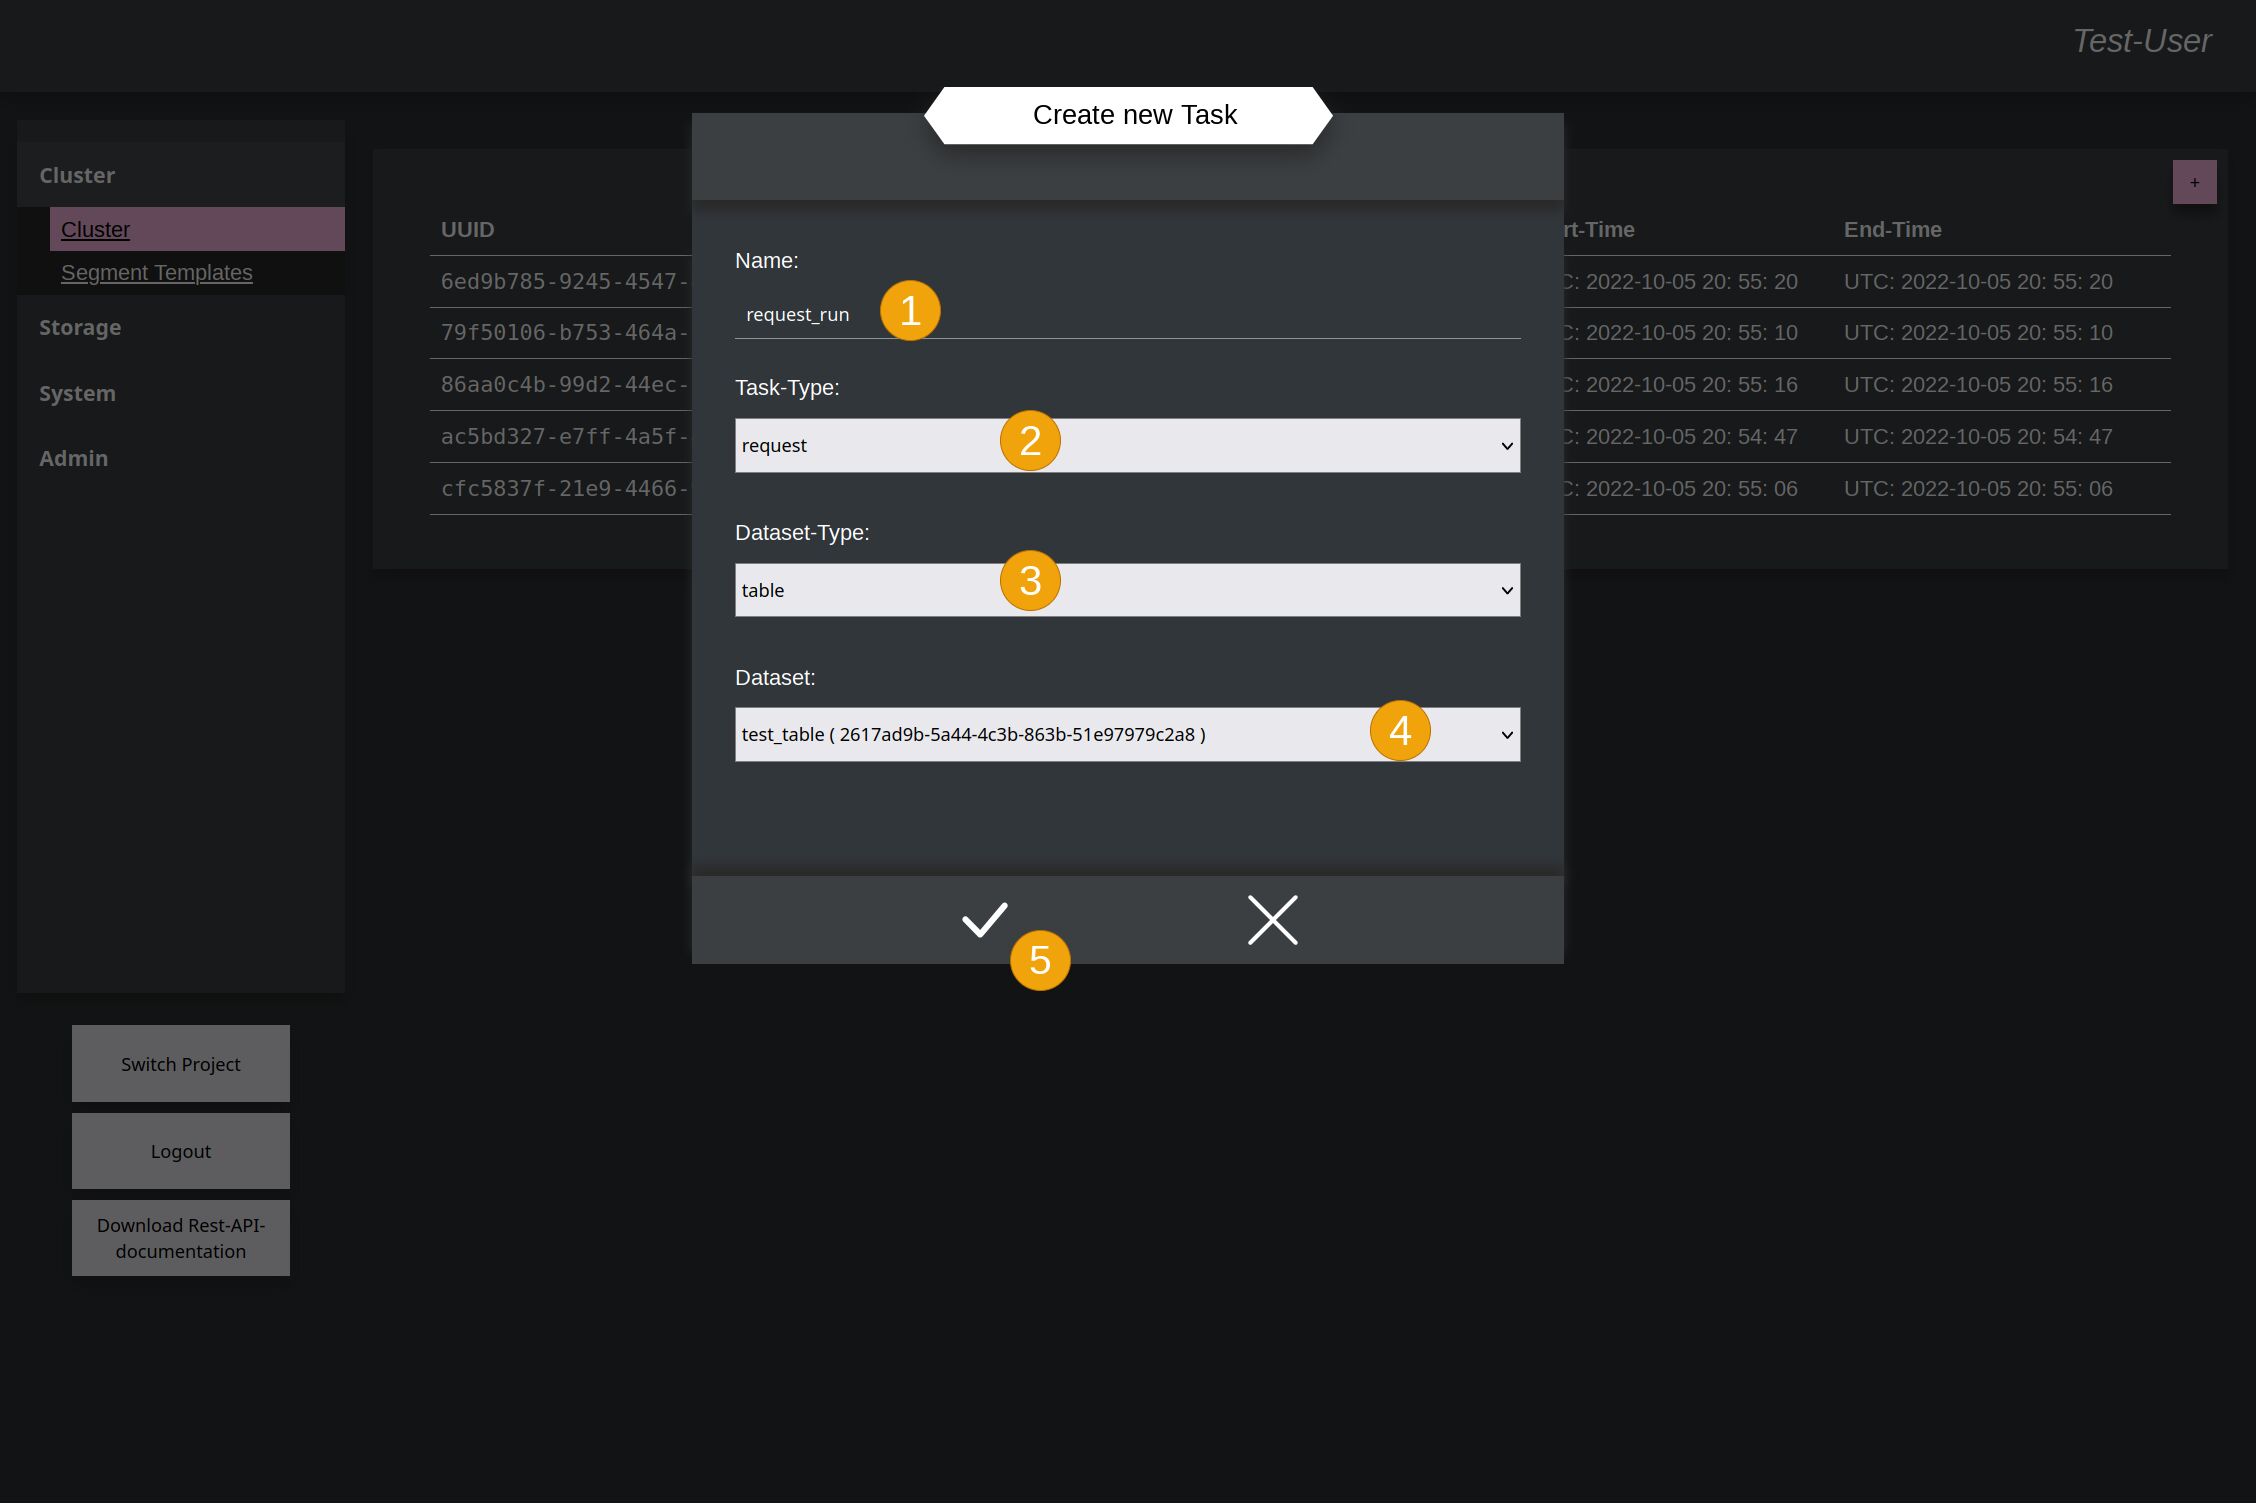
After the Cluster was trained with some data, now a Request-Task can be created to see how the result looks, when only input-data are given. Create a new task again and give it a name (1). This name will be the same like the Result at the end for better identification. Select with time request (2) as task-type. Type (3) and Data-set (4) are the same like last time while learning. And accept (5) again to create the task.
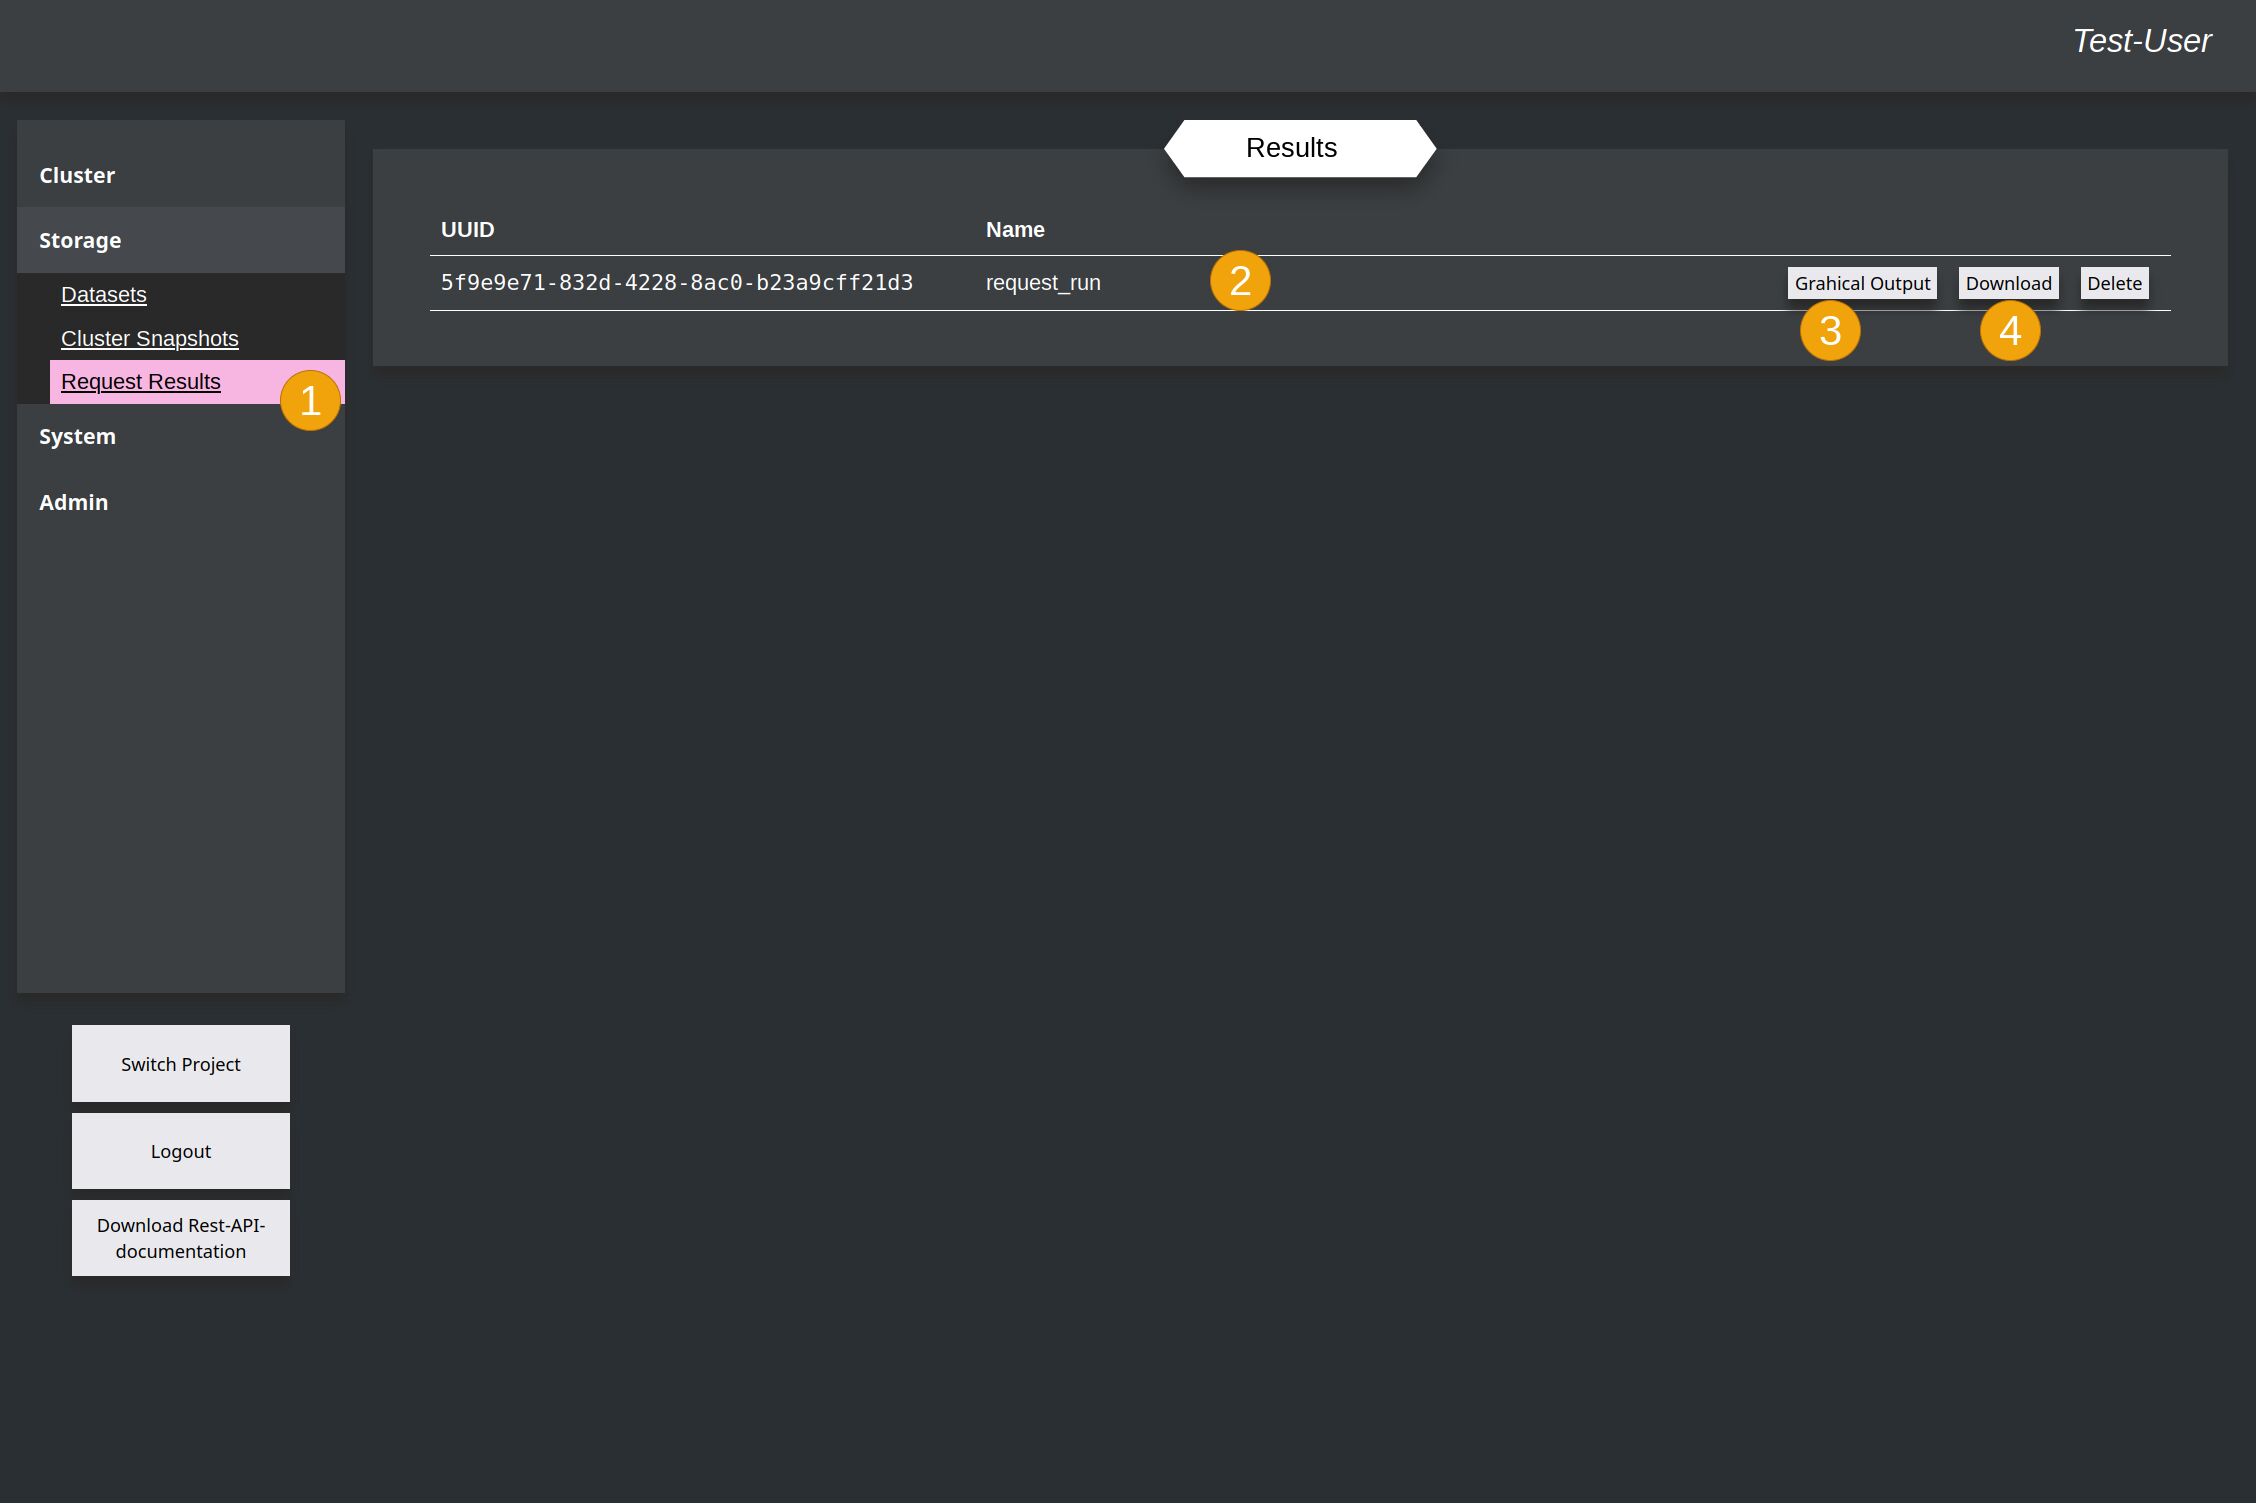
To see the result of the task after it was finished, you have to switch to the Request-Result-chapter (1) in the Storage-section, because at the end, Kyouko send the result to Shiori to write this in the database. Here the result is listed with the same name, like the request-task (2). Now the result can be downloaded (4) as json-formated string in a file or directly shown as graph (3) with the help of the d3-library.
Result for the Train-file:
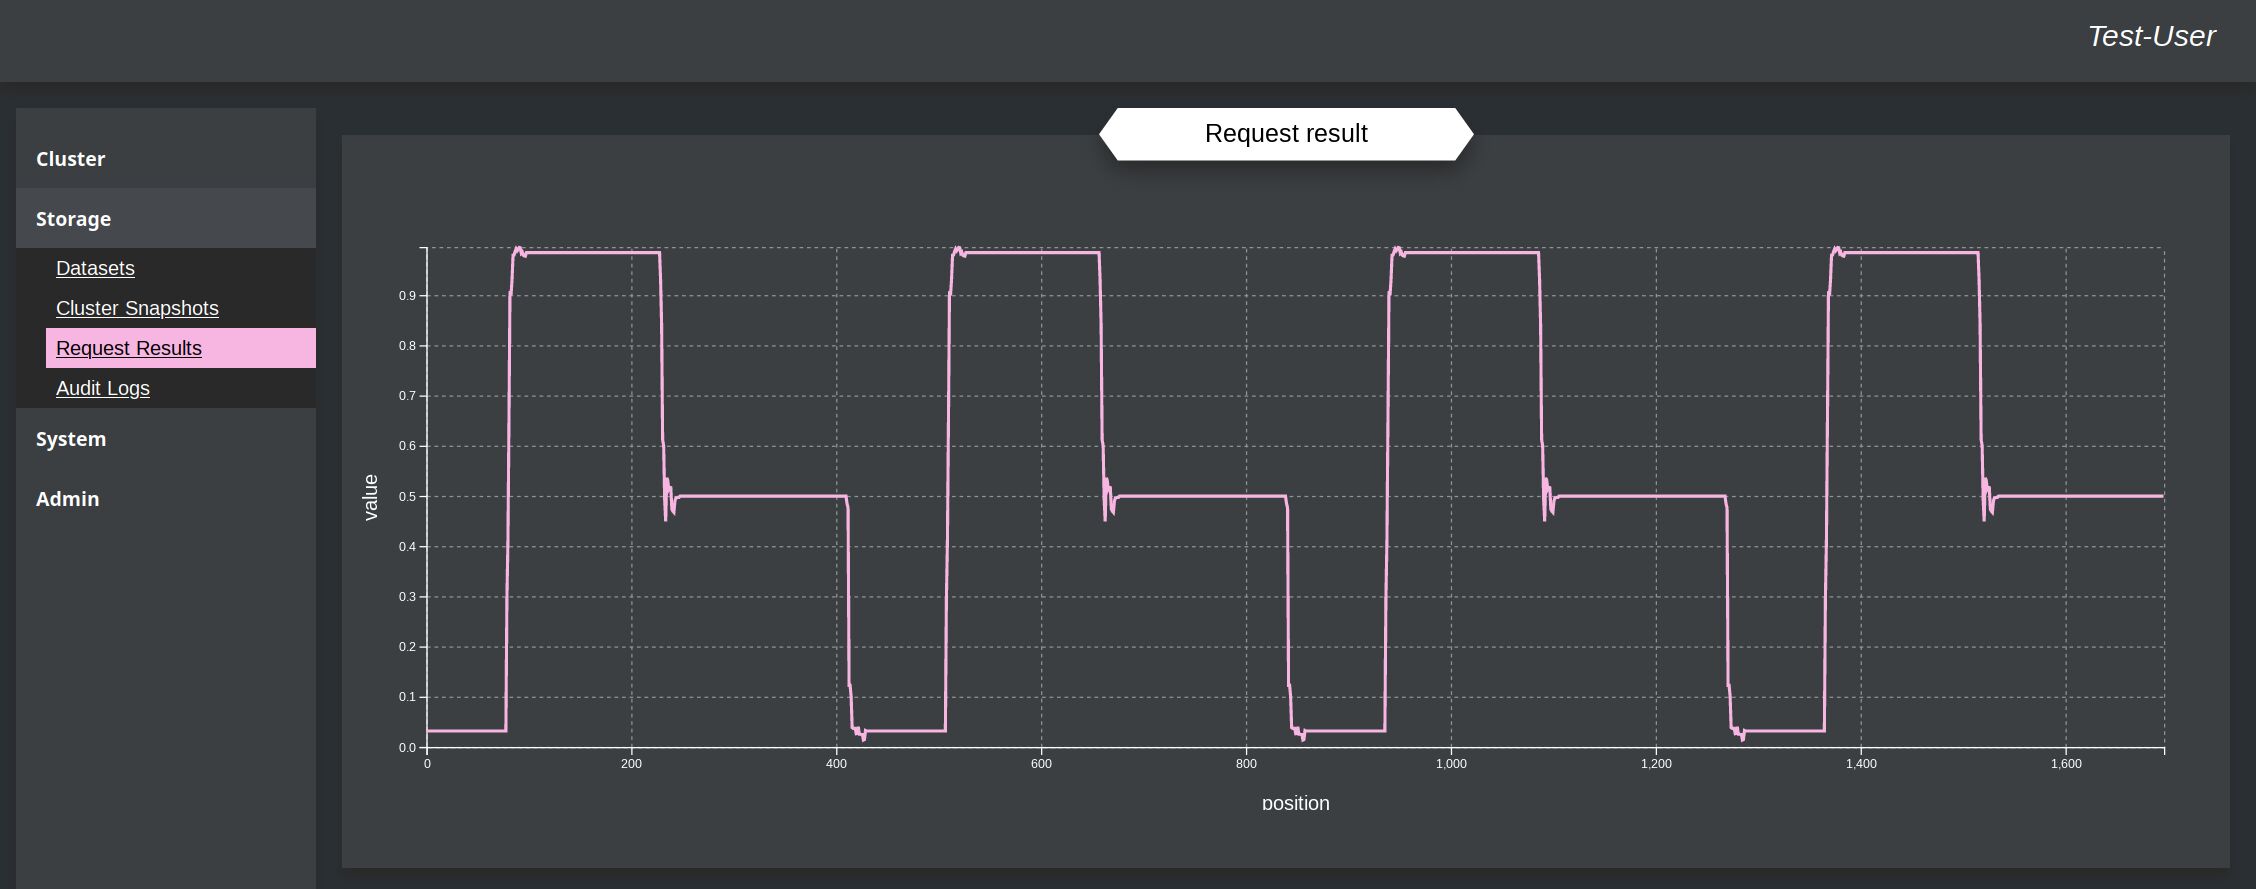
Result for the Test-file
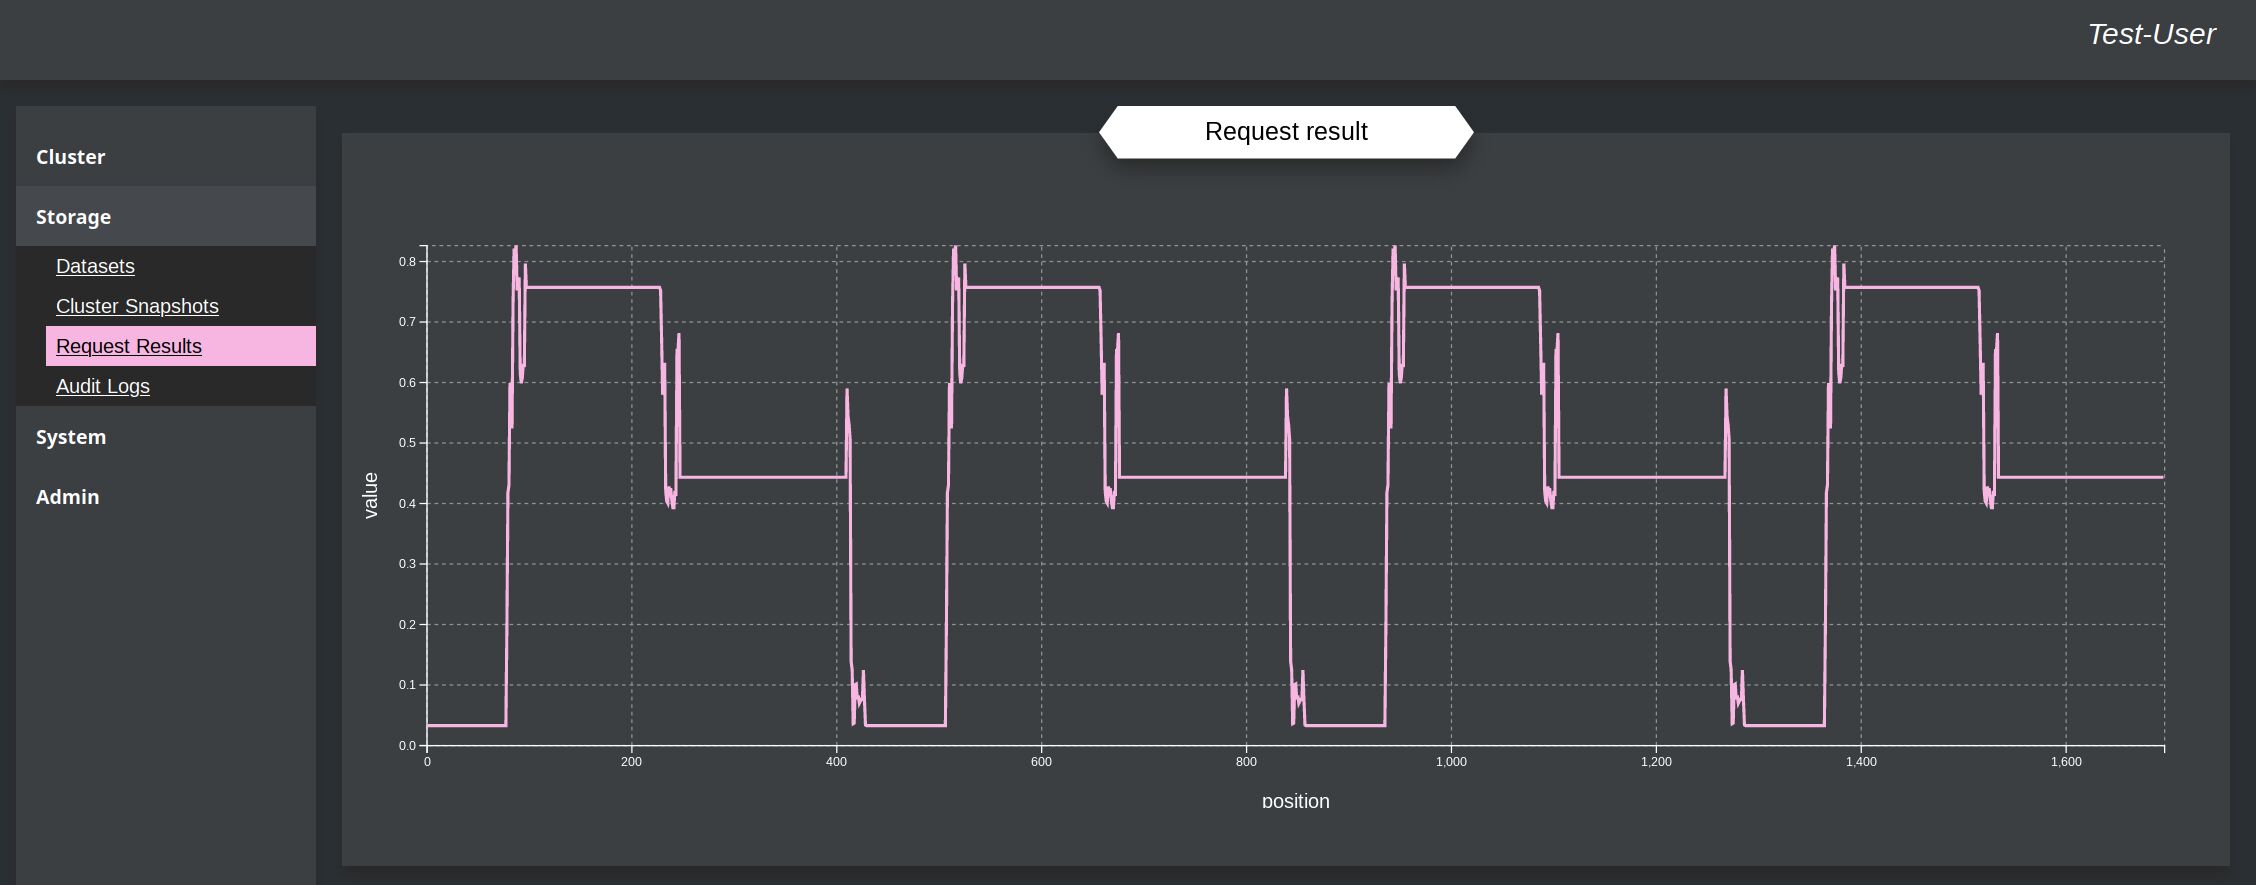
The output of this example is not optimal, but basically correct, when comparing the the up-and-down of the given input-values above. With a more optimal templates or more train-tasks, the graph would look better. There is on the upper picture the real output of the cluster the on the other the rounded values, where all above 0.5 is rounded to 1.0 and the rest to 0.0.
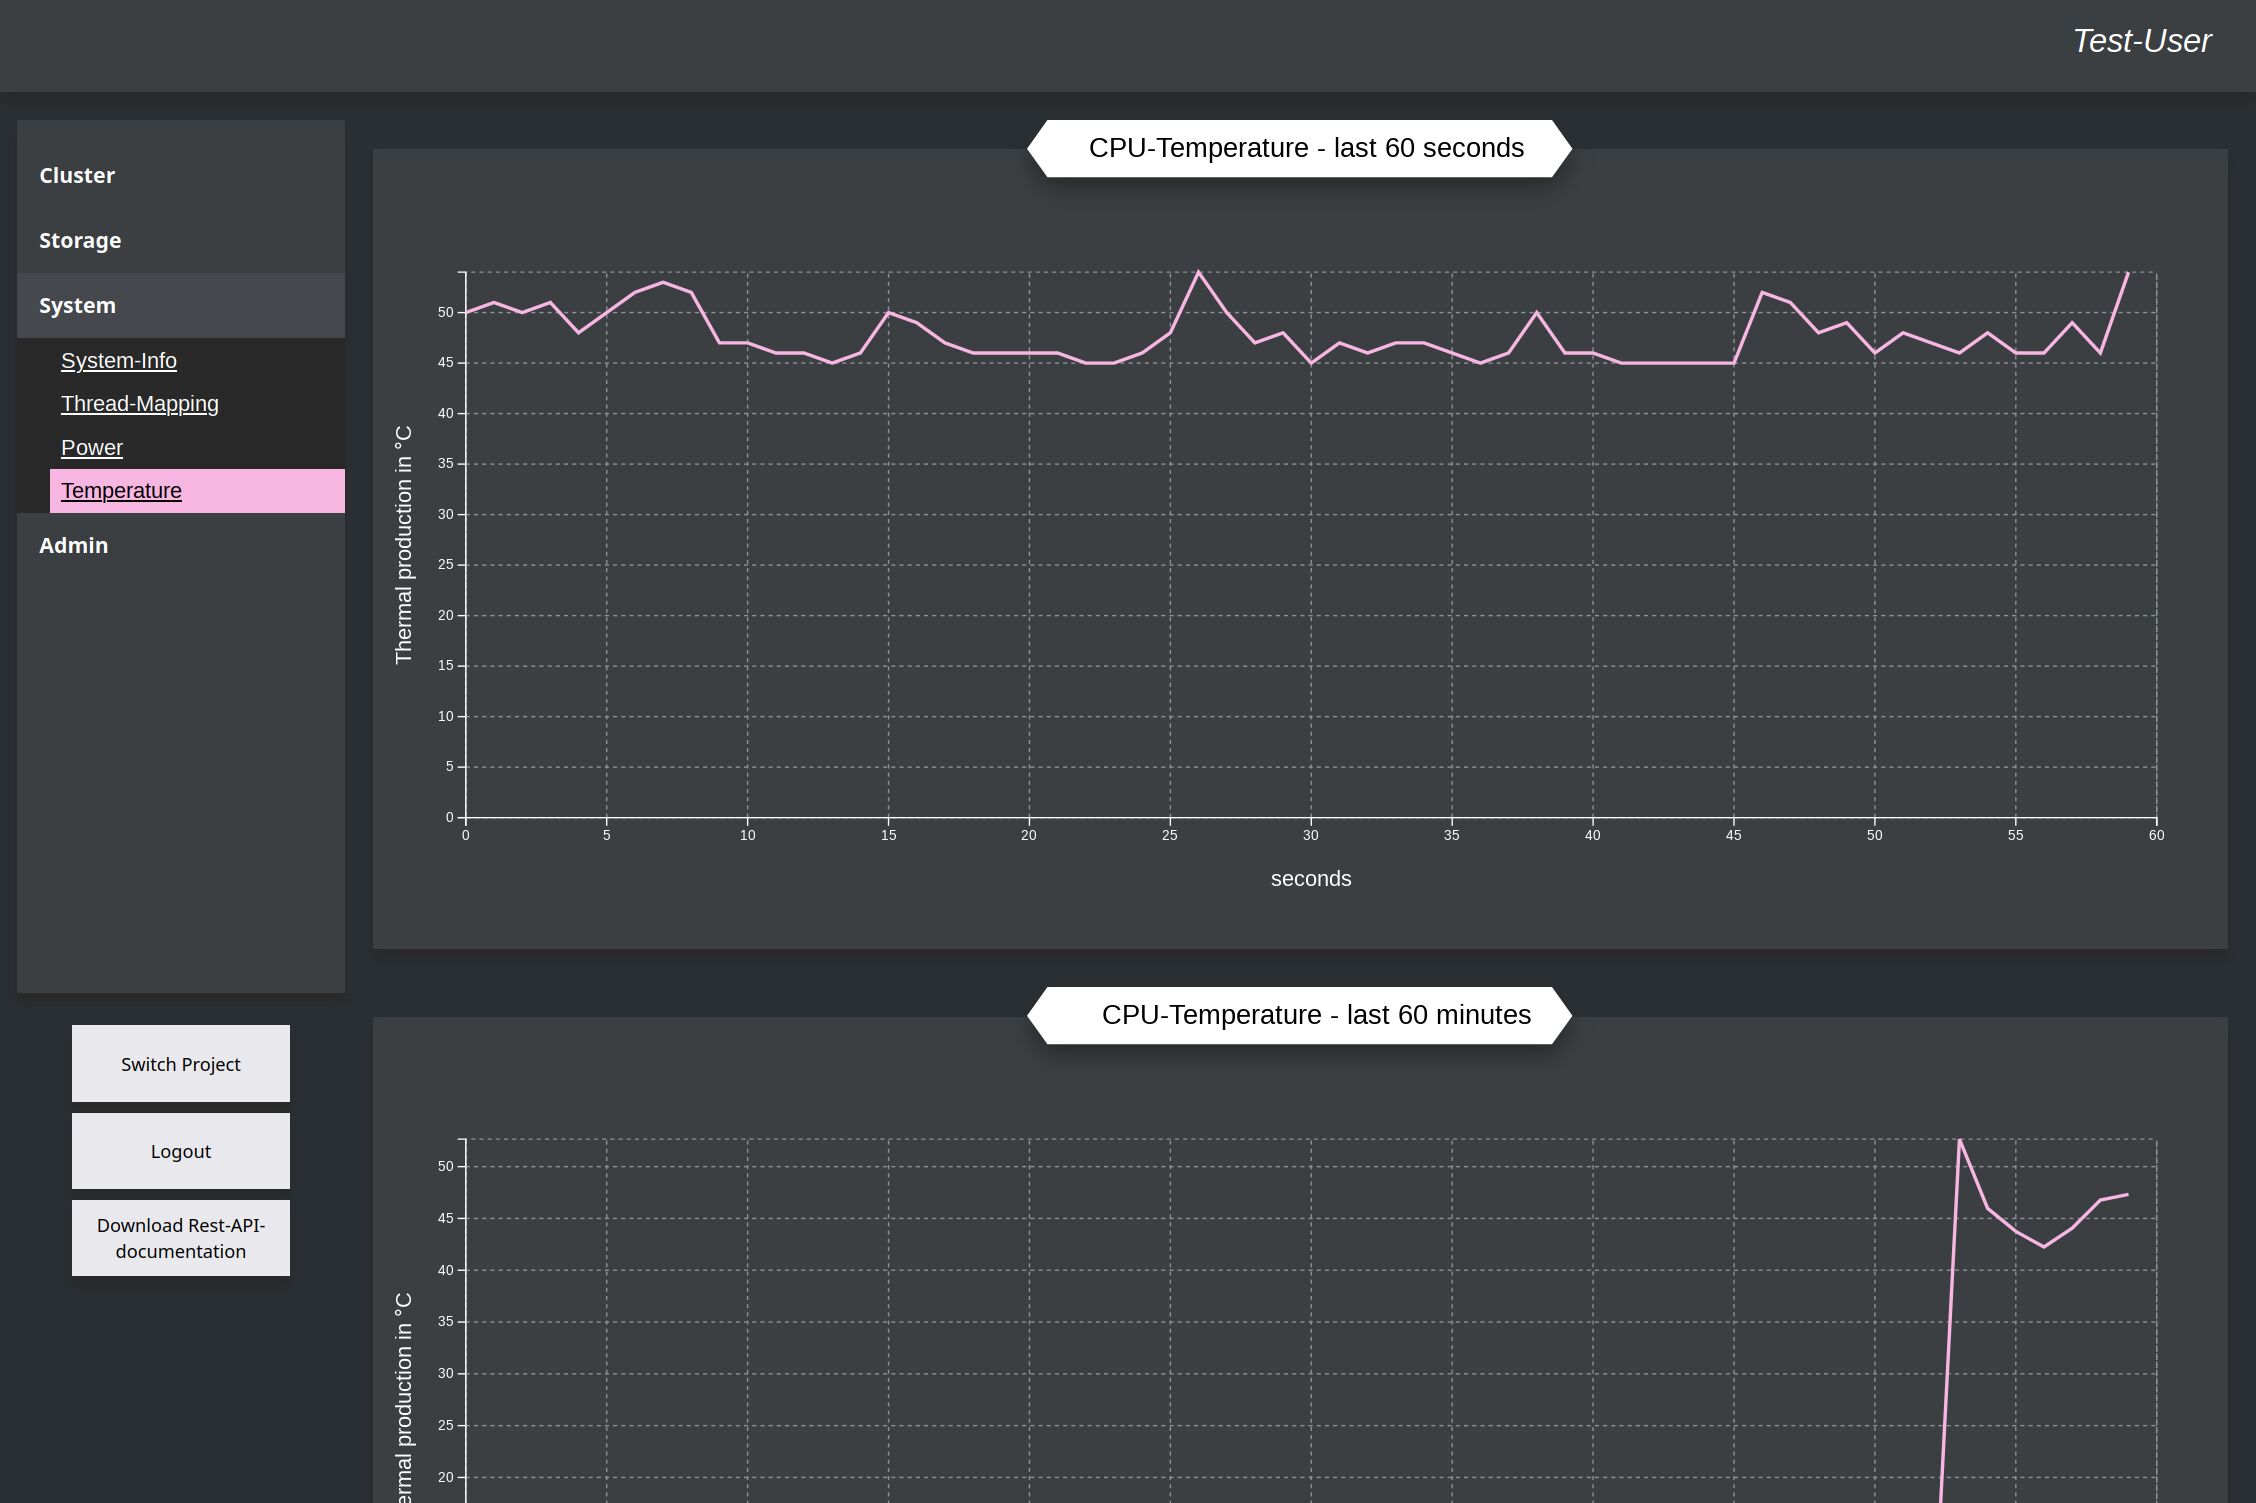
Other
As additional feature for example you can also show the thermal output the CPU of the node, where the project is running.